

18、kubernetes之kube-state-metrics监控接入
前面部署了metrics-server、cadvisor(集成在kubelet内)监控指标基本都已经能拿到,但是这些都是在应用内部,需要在应用提供or开启/metrics接口,或者部署exports来暴漏对应的指标,但是对于deployment,Pod、daemonset、cronjob等k8s资源对象并没有监控,比如:当前replace是多少?Pod当前状态(pending or running?)cadvisor并没有对具体的资源对象就行监控,因此就需引用新的exports来暴漏监控指标,如kube-state-metrics。
需要注意的是,kube-state-metrics并不能替代Metrics Server。毕竟Metrics Server可以帮助用户监控群集节点和Pod上的CPU与内存的使用情况。而kube-state-metrics服务则是协助用户监控有关Pod、节点、以及其他Kubernetes对象的数量、运行状况、以及可用性信息等群集状态。
整体来看,kube-state-metrics是为prometheus采集k8s资源数据的exporter。prometheus 的exporter任务是将和业务相关的数据指标转换成prometheus的数据模型,当然prometheus 为这种转换提供了方法。
k8s接入集群外部的prometheus进行监控
参考:https://www.cnblogs.com/lifuqiang/articles/17126446.html
https://blog.51cto.com/u_64214/6339114
https://www.cnblogs.com/Mr-Axin/p/14756642.html
1、选择版本,避免返工
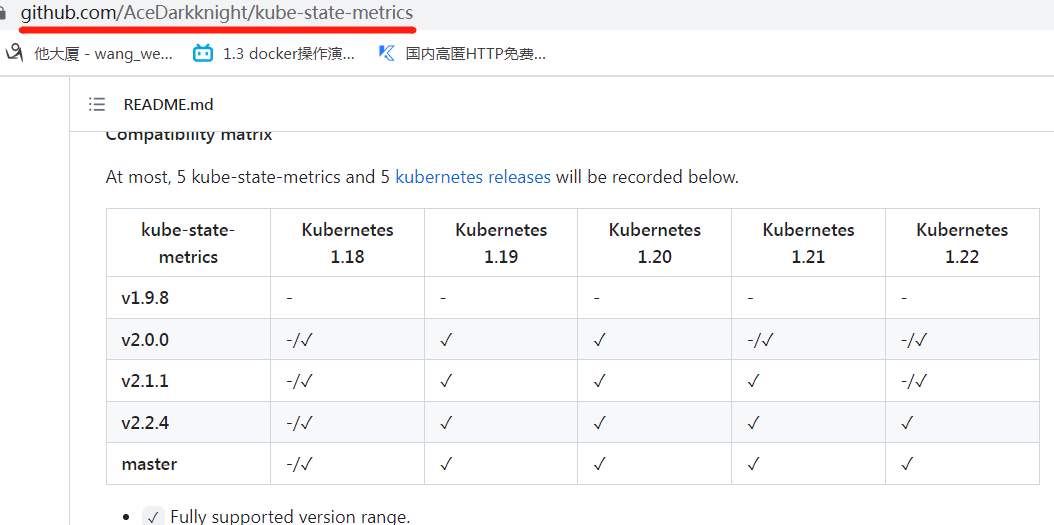
对应的版本,要求一致。https://github.com/AceDarkknight/kube-state-metrics
2、下载将如下几个文件
地址:https://github.com/kubernetes/kube-state-metrics/blob/v2.2.4/examples/standard/deployment.yaml
cluster-role-binding.yaml
cluster-role.yaml
deployment.yaml
service-account.yaml
service.yaml
for i in `cat 1.txt`;do wget https://raw.githubusercontent.com/kubernetes/kube-state-metrics/v2.2.4/examples/standard/$i;sleep 1;done
3、创建pod
[root@k8s-master kube-state-metrics]# cd /app/prome/kube-state-metrics
[root@k8s-master kube-state-metrics]# ll
总用量 20
-rw-r--r-- 1 root root 376 7月 27 17:36 cluster-role-binding.yaml
-rw-r--r-- 1 root root 1623 7月 27 17:36 cluster-role.yaml
-rw-r--r-- 1 root root 1134 7月 27 17:36 deployment.yaml
-rw-r--r-- 1 root root 192 7月 27 17:36 service-account.yaml
-rw-r--r-- 1 root root 405 7月 27 17:36 service.yaml
[root@k8s-master kube-state-metrics]# kubectl create -f .
[root@k8s-master kube-state-metrics]# kubectl get pods -n kube-system -owide|grep kube-state-metrics
kube-state-metrics-796fd466b5-9zvc2      0/1     Running   0          39m   10.244.1.100    k8s-node1    <none>           <none>
[root@k8s-master kube-state-metrics]# kubectl describe  pods kube-state-metrics-796fd466b5-9zvc2 -n kube-system
Name:               kube-state-metrics-796fd466b5-9zvc2
...
  Normal   BackOff         14m (x84 over 38m)     kubelet, k8s-node1  Back-off pulling image "k8s.gcr.io/kube-state-metrics/kube-state-metrics:v2.2.4"
  Warning  Failed          9m13s (x103 over 38m)  kubelet, k8s-node1  Error: ImagePullBackOff
node节点在国内找个可以下载的地址,下载镜像。
[root@k8s-node1 ~]# docker pull bitnami/kube-state-metrics:2.2.4
[root@k8s-node1 ~]# docker tag bitnami/kube-state-metrics:2.2.4 k8s.gcr.io/kube-state-metrics/kube-state-metrics:v2.2.4
再次查看,pod正常启动。
[root@k8s-master kube-state-metrics]# kubectl get pods -n kube-system -owide|grep kube-state-metrics
kube-state-metrics-796fd466b5-9zvc2 1/1 Running 0 39m 10.244.1.100 k8s-node1 <none> <none>
验证:
[root@k8s-master kube-state-metrics]# curl 10.244.1.100:8080 -w '\n'
<html>
<head><title>Kube Metrics Server</title></head>
...
[root@k8s-master kube-state-metrics]# curl 10.244.1.100:8080/healthz -w '\n'
OK
[root@k8s-master ~]# kubectl delete pod kube-state-metrics-796fd466b5-9zvc2 -n kube-system # pod被误删除后,新pod地址变了。
[root@k8s-master ~]# kubectl get pod -n kube-system -owide|grep stat
kube-state-metrics-796fd466b5-q2sbf 1/1 Running 0 28s 10.244.1.101 k8s-node1 <none>
[root@k8s-master ~]# kubectl get svc kube-state-metrics -n kube-system # /app/prome/kube-state-metrics/service.yam l服务调整为nodeport模式,或者clusterip都可以。
NAME TYPE CLUSTER-IP EXTERNAL-IP PORT(S) AGE
kube-state-metrics ClusterIP None <none> 8080/TCP,8081/TCP 125m
4、安装nginx
这里暂不演示,直接调整文件重新生成固定的地址,第二如果提供外部访问的,可以通过nginx代理对外暴露。
[root@k8s-master ~]# yum -y install pcre-devel zlib-devel gcc gcc-c++ openssl-devel gd-devel gd make
[root@k8s-master ~]# cd /app/prome/
[root@k8s-master prome]# wget http://nginx.org/download/nginx-1.16.1.tar.gz
[root@k8s-master prome]# tar -xf nginx-1.16.1.tar.gz
[root@k8s-master prome]# cd nginx-1.16.1
[root@k8s-master nginx-1.16.1]# ./configure --prefix=/usr/local/nginx --with-http_realip_module --with-http_sub_module --with-http_gzip_static_module --with-http_stub_status_module --with-pcre --with-http_ssl_module
[root@k8s-master nginx-1.16.1]# make && make install
[root@k8s-master nginx-1.16.1]# /usr/local/nginx/sbin/nginx -t
[root@k8s-master nginx-1.16.1]# /usr/local/nginx/sbin/nginx 启动ng
[root@k8s-master nginx-1.16.1]# netstat -lnpt |grep nginx
tcp 0 0 0.0.0.0:80 0.0.0.0:* LISTEN 40907/nginx: master
[root@k8s-master conf]# tail -2 nginx.conf
include vhosts/*.conf;
}
[root@k8s-master conf]# mkdir -p /usr/local/nginx/conf/vhosts
[root@k8s-master conf]# cat /usr/local/nginx/conf/vhosts/kube-state-metrics.conf
server {
  listen       8881;
  server_name  localhost;
  location / {
     proxy_pass  http://10.244.1.101:8080;
  }
}
[root@k8s-master conf]# ../sbin/nginx -s reload
命令行或者浏览器访问http://192.168.1.203:8881/
[root@k8s-node1 ~]# curl 192.168.1.203:8881/healthz -w '\n'
OK
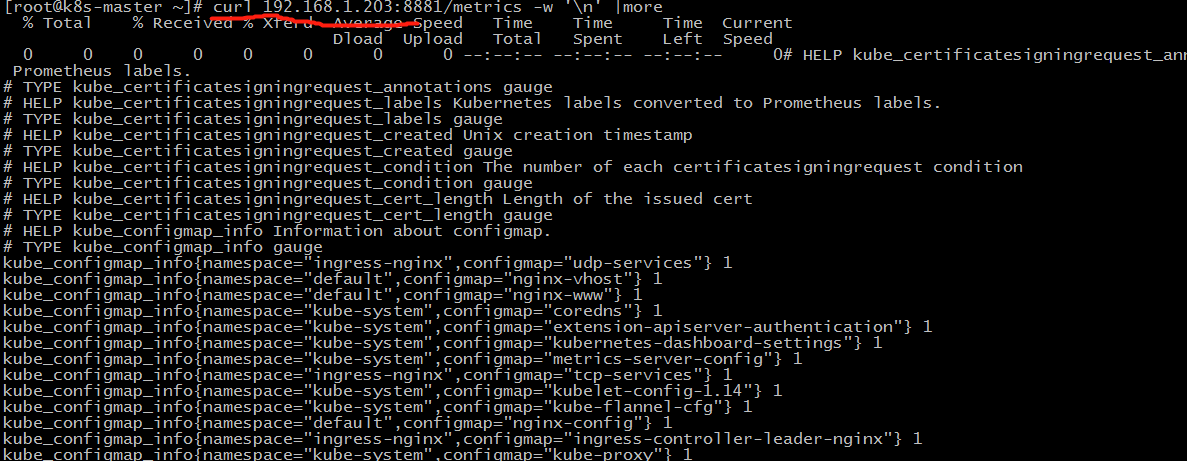
[root@k8s-node1 ~]# curl 192.168.1.203:8881/metrics -w '\n' |more
5、安装promethues
自行安装:https://www.cnblogs.com/sunnyyangwang/p/14386897.html
6、prometheus监控k8s
上面已经能取到数据了,现在需要服务器端配置。
[root@k8s-master ~]# tail -4 /app/prome/prometheus/etc/prometheus.yml
[root@k8s-master ~]# tail -4 /app/prome/prometheus/etc/prometheus.yml
  - job_name: 'kube-state'
    metrics_path: '/metrics'
    static_configs:
    - targets: ['192.168.1.203:8881']
[root@k8s-master conf]# /usr/local/bin/prometheus --config.file /app/prome/prometheus/etc/prometheus.yml # 没有配置热加载,只能重启服务
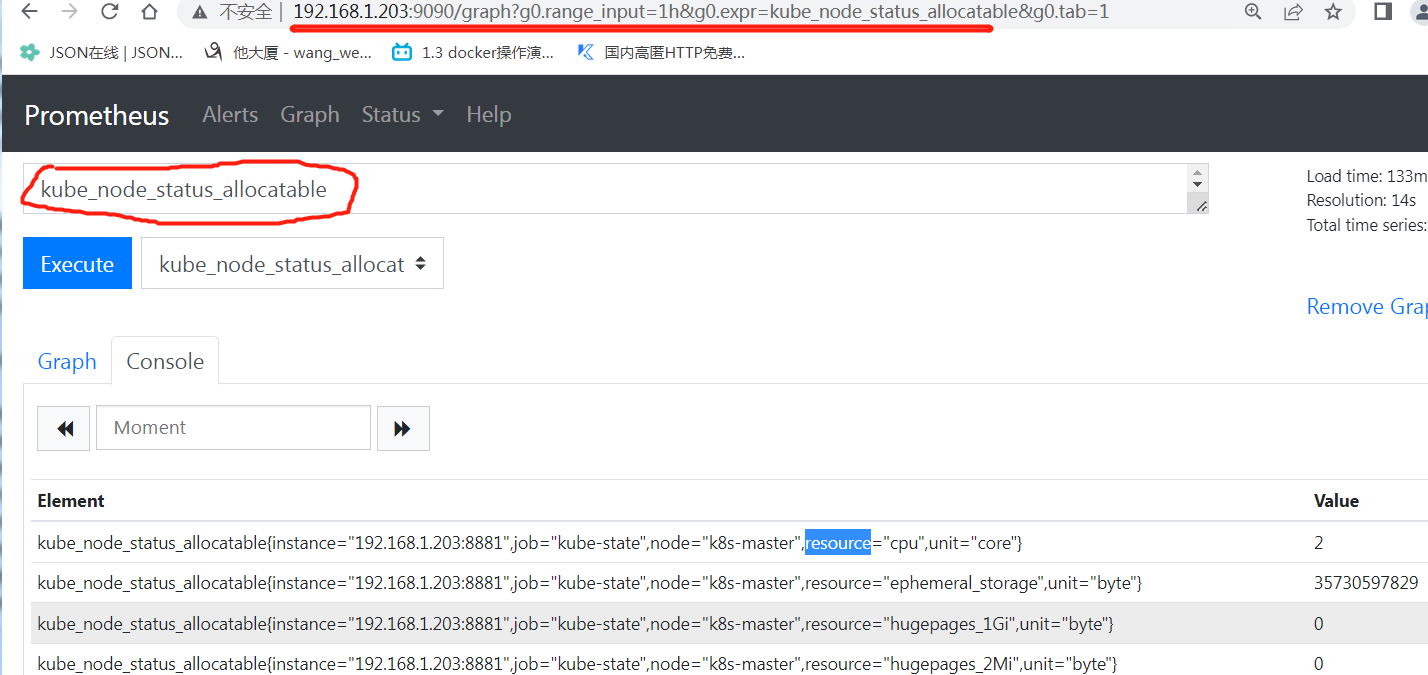
浏览器上查看:http://k8s-master:9090/
可能会有错误提示,需要同步时间服务器。
Warning! Detected 60.44 seconds time difference between your browser and the server. Prometheus relies on accurate time and time drift might cause unexpected query results.
[root@k8s-master ~]# ntpdate time.nist.gov
7、grafana展示
安装部署这里就不说了:https://www.cnblogs.com/sunnyyangwang/p/14386897.html
参考:https://blog.51cto.com/u_64214/6339114
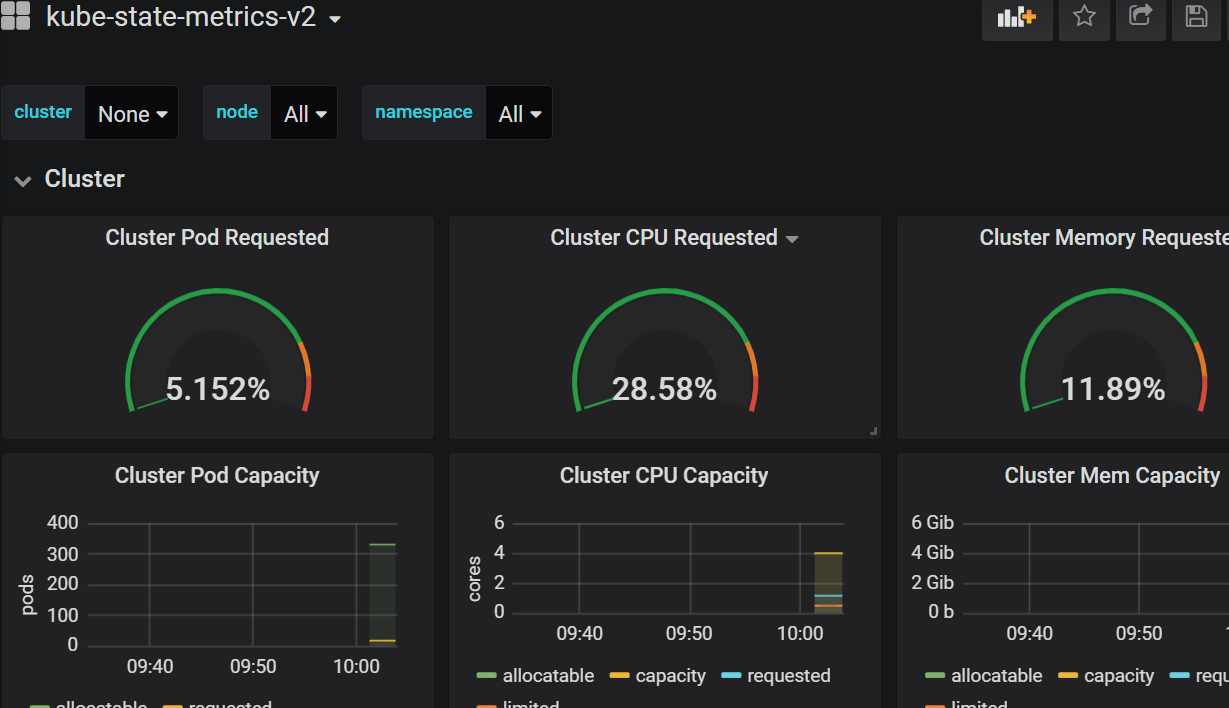
假如现在grafana已安装完毕,promethues也已经能够监控到k8s数据了。
导入模板:13332,6417
截图数据展示。
至此,如果想自定义模板,则需进一步研究grafana模板创建方法。


【推荐】国内首个AI IDE,深度理解中文开发场景,立即下载体验Trae
【推荐】编程新体验,更懂你的AI,立即体验豆包MarsCode编程助手
【推荐】抖音旗下AI助手豆包,你的智能百科全书,全免费不限次数
【推荐】轻量又高性能的 SSH 工具 IShell:AI 加持,快人一步
· AI与.NET技术实操系列:基于图像分类模型对图像进行分类
· go语言实现终端里的倒计时
· 如何编写易于单元测试的代码
· 10年+ .NET Coder 心语,封装的思维:从隐藏、稳定开始理解其本质意义
· .NET Core 中如何实现缓存的预热?
· 25岁的心里话
· 闲置电脑爆改个人服务器(超详细) #公网映射 #Vmware虚拟网络编辑器
· 零经验选手,Compose 一天开发一款小游戏!
· 通过 API 将Deepseek响应流式内容输出到前端
· AI Agent开发,如何调用三方的API Function,是通过提示词来发起调用的吗