
记一次部署系列:grafana配置特定指标进行邮件告警
1、修改配置
修改grafana配置文件default.ini,然后重启grafana服务,我这里做了系统服务grafana-server(参考:https://www.cnblogs.com/sunnytomorrow/p/16068405.html)
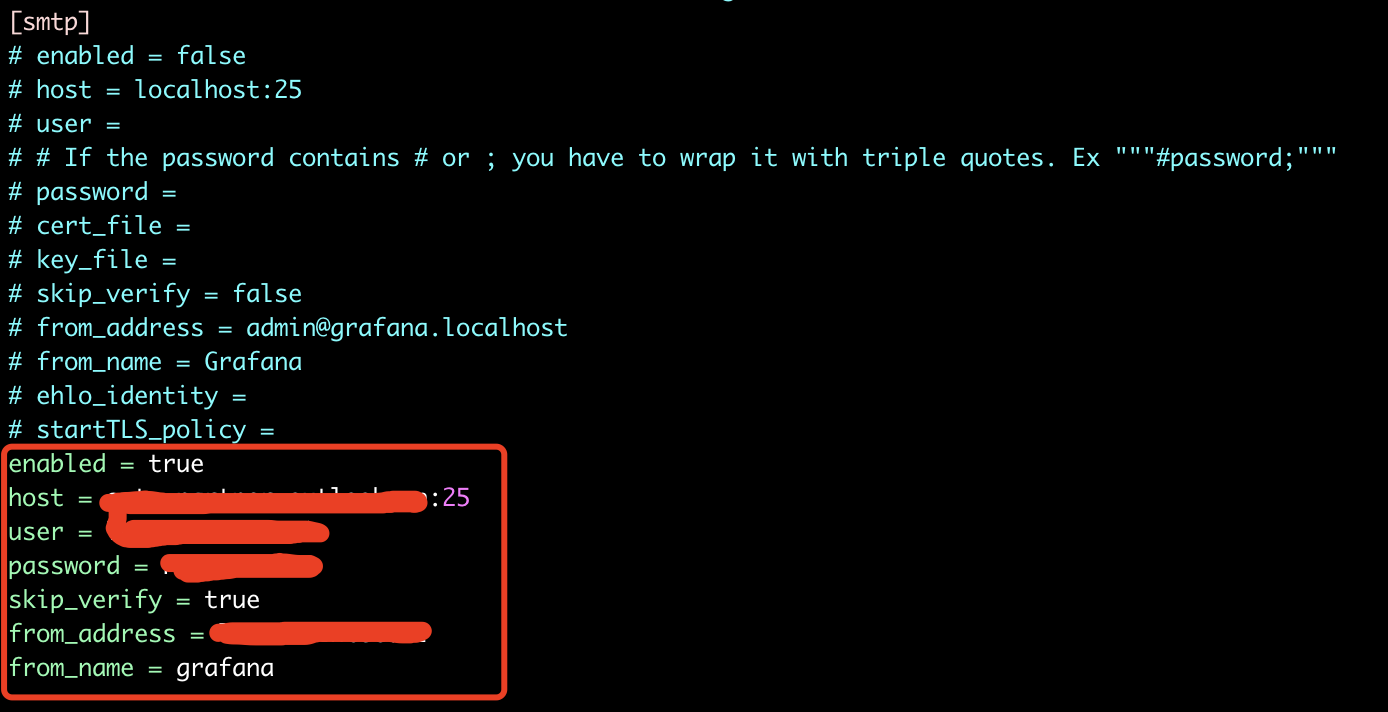
]# systemctl restart grafana-server
]# systemctl status grafana-server
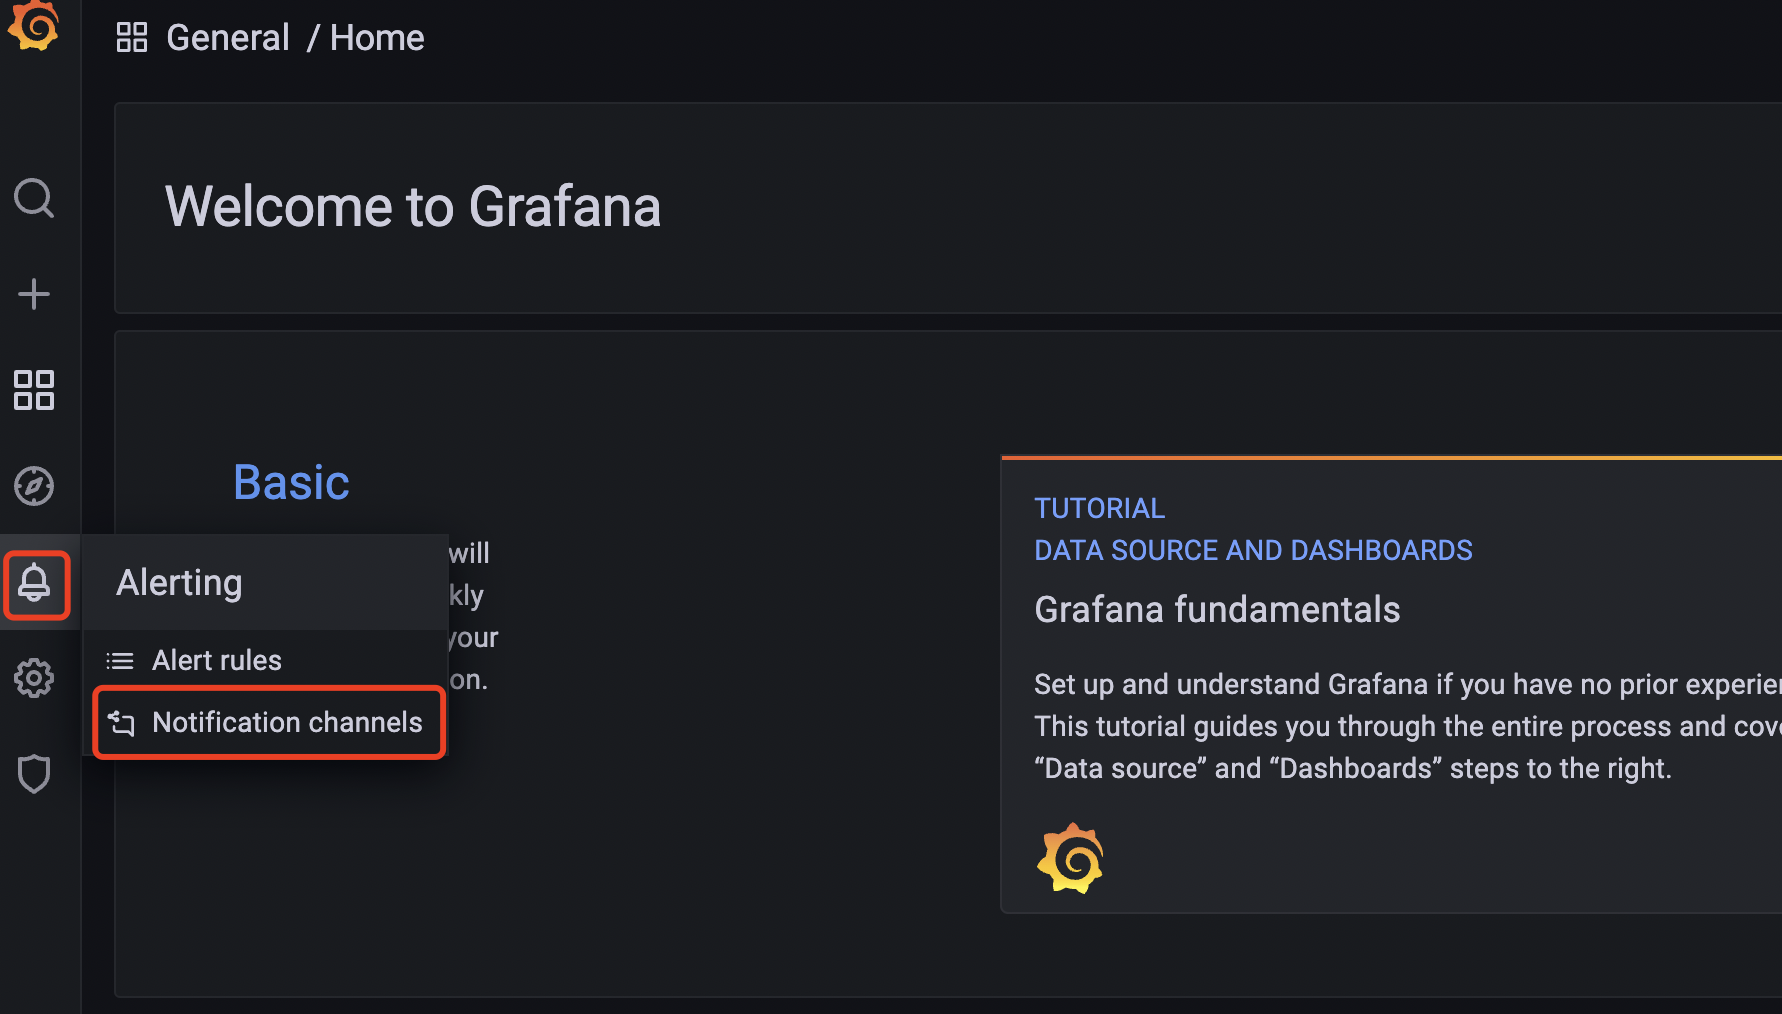
2、配置邮件发送
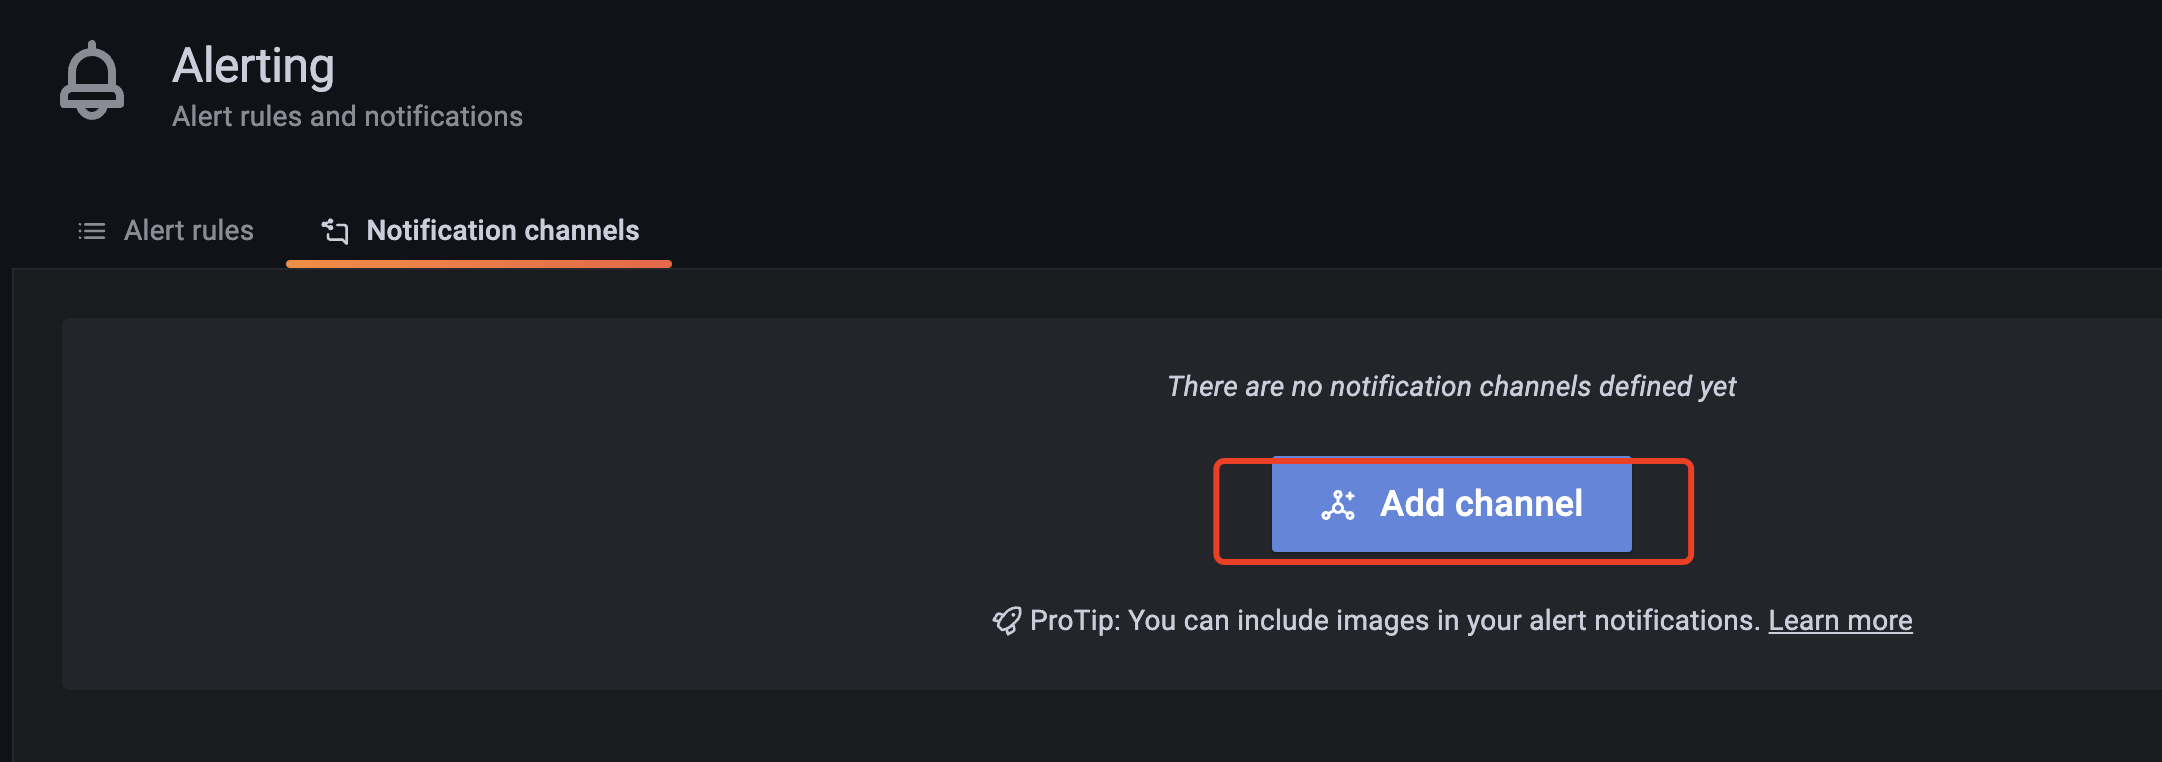
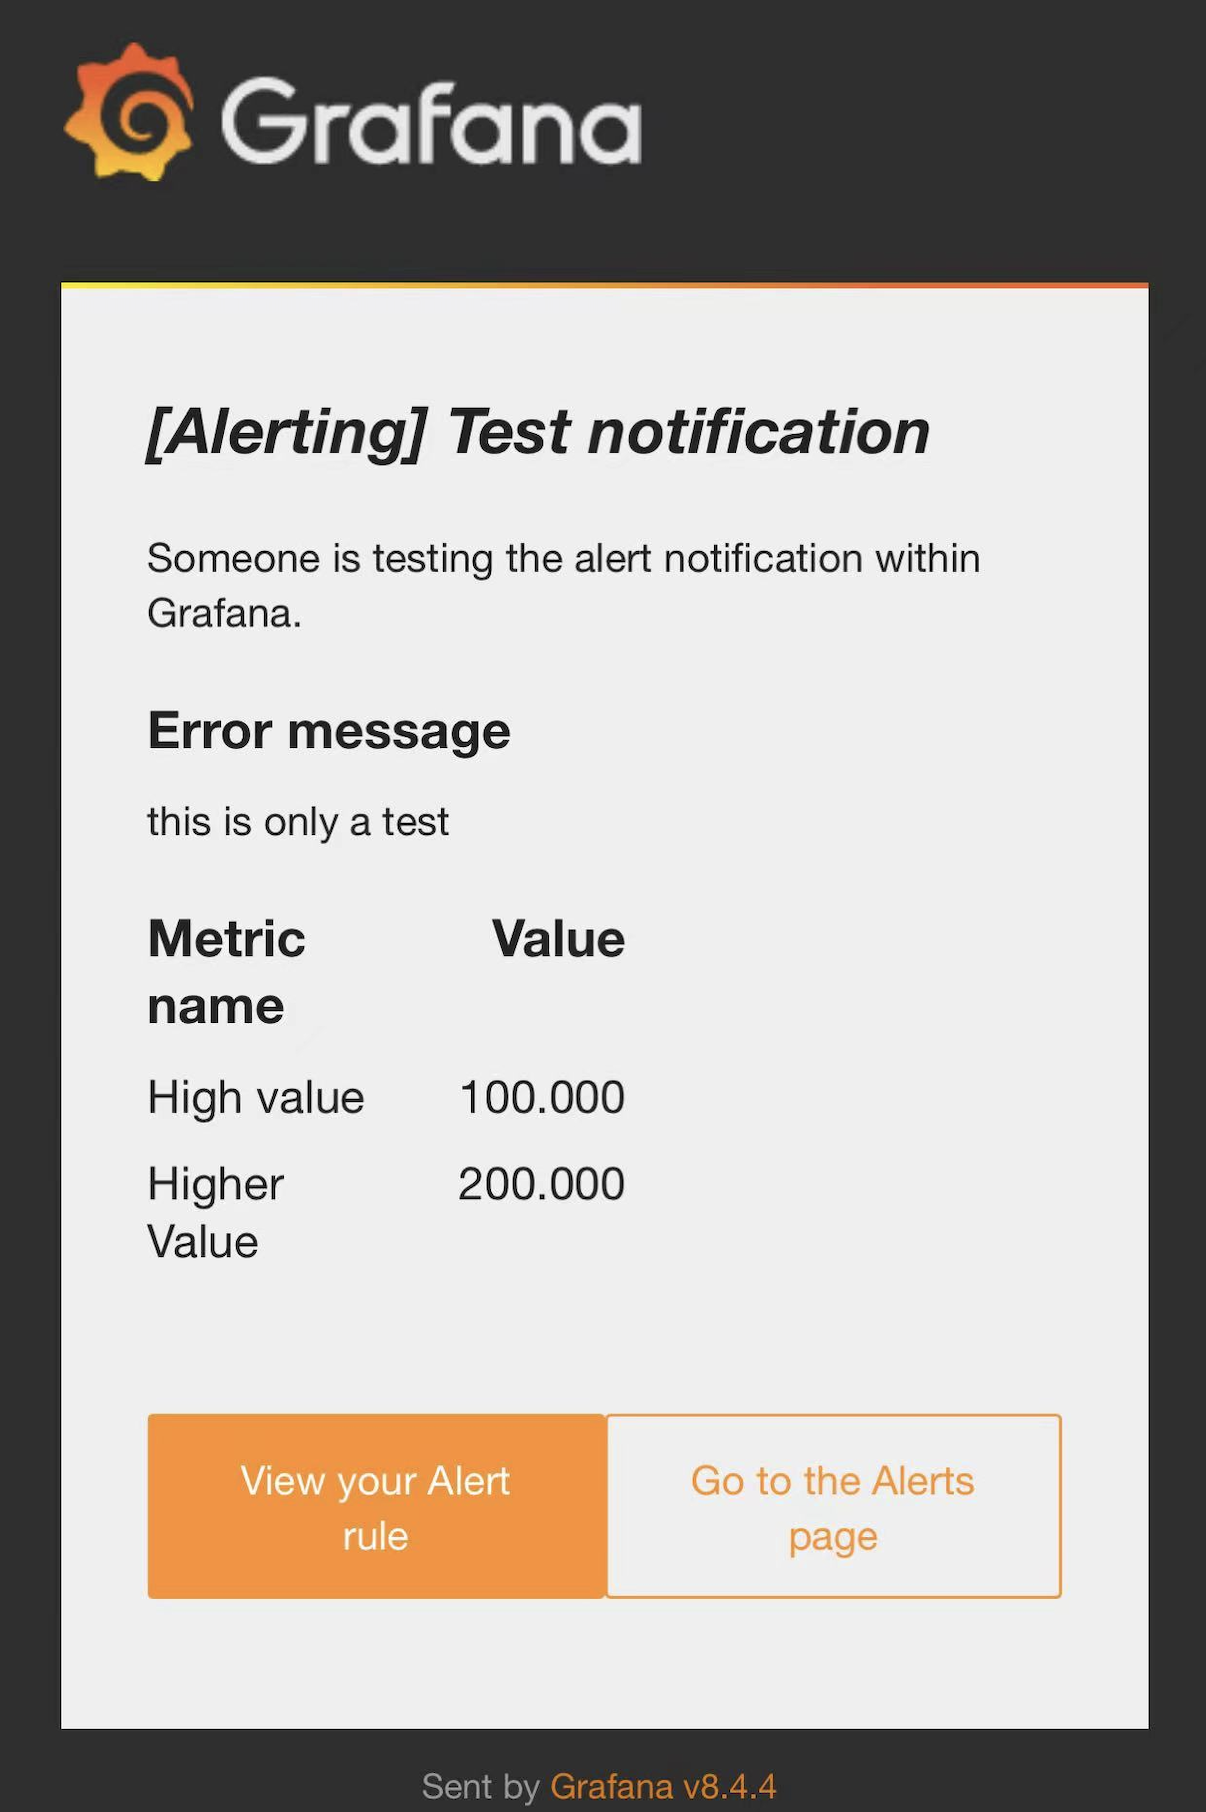
访问grafana页面,配置并测试邮件发送,最后点击save进行保存
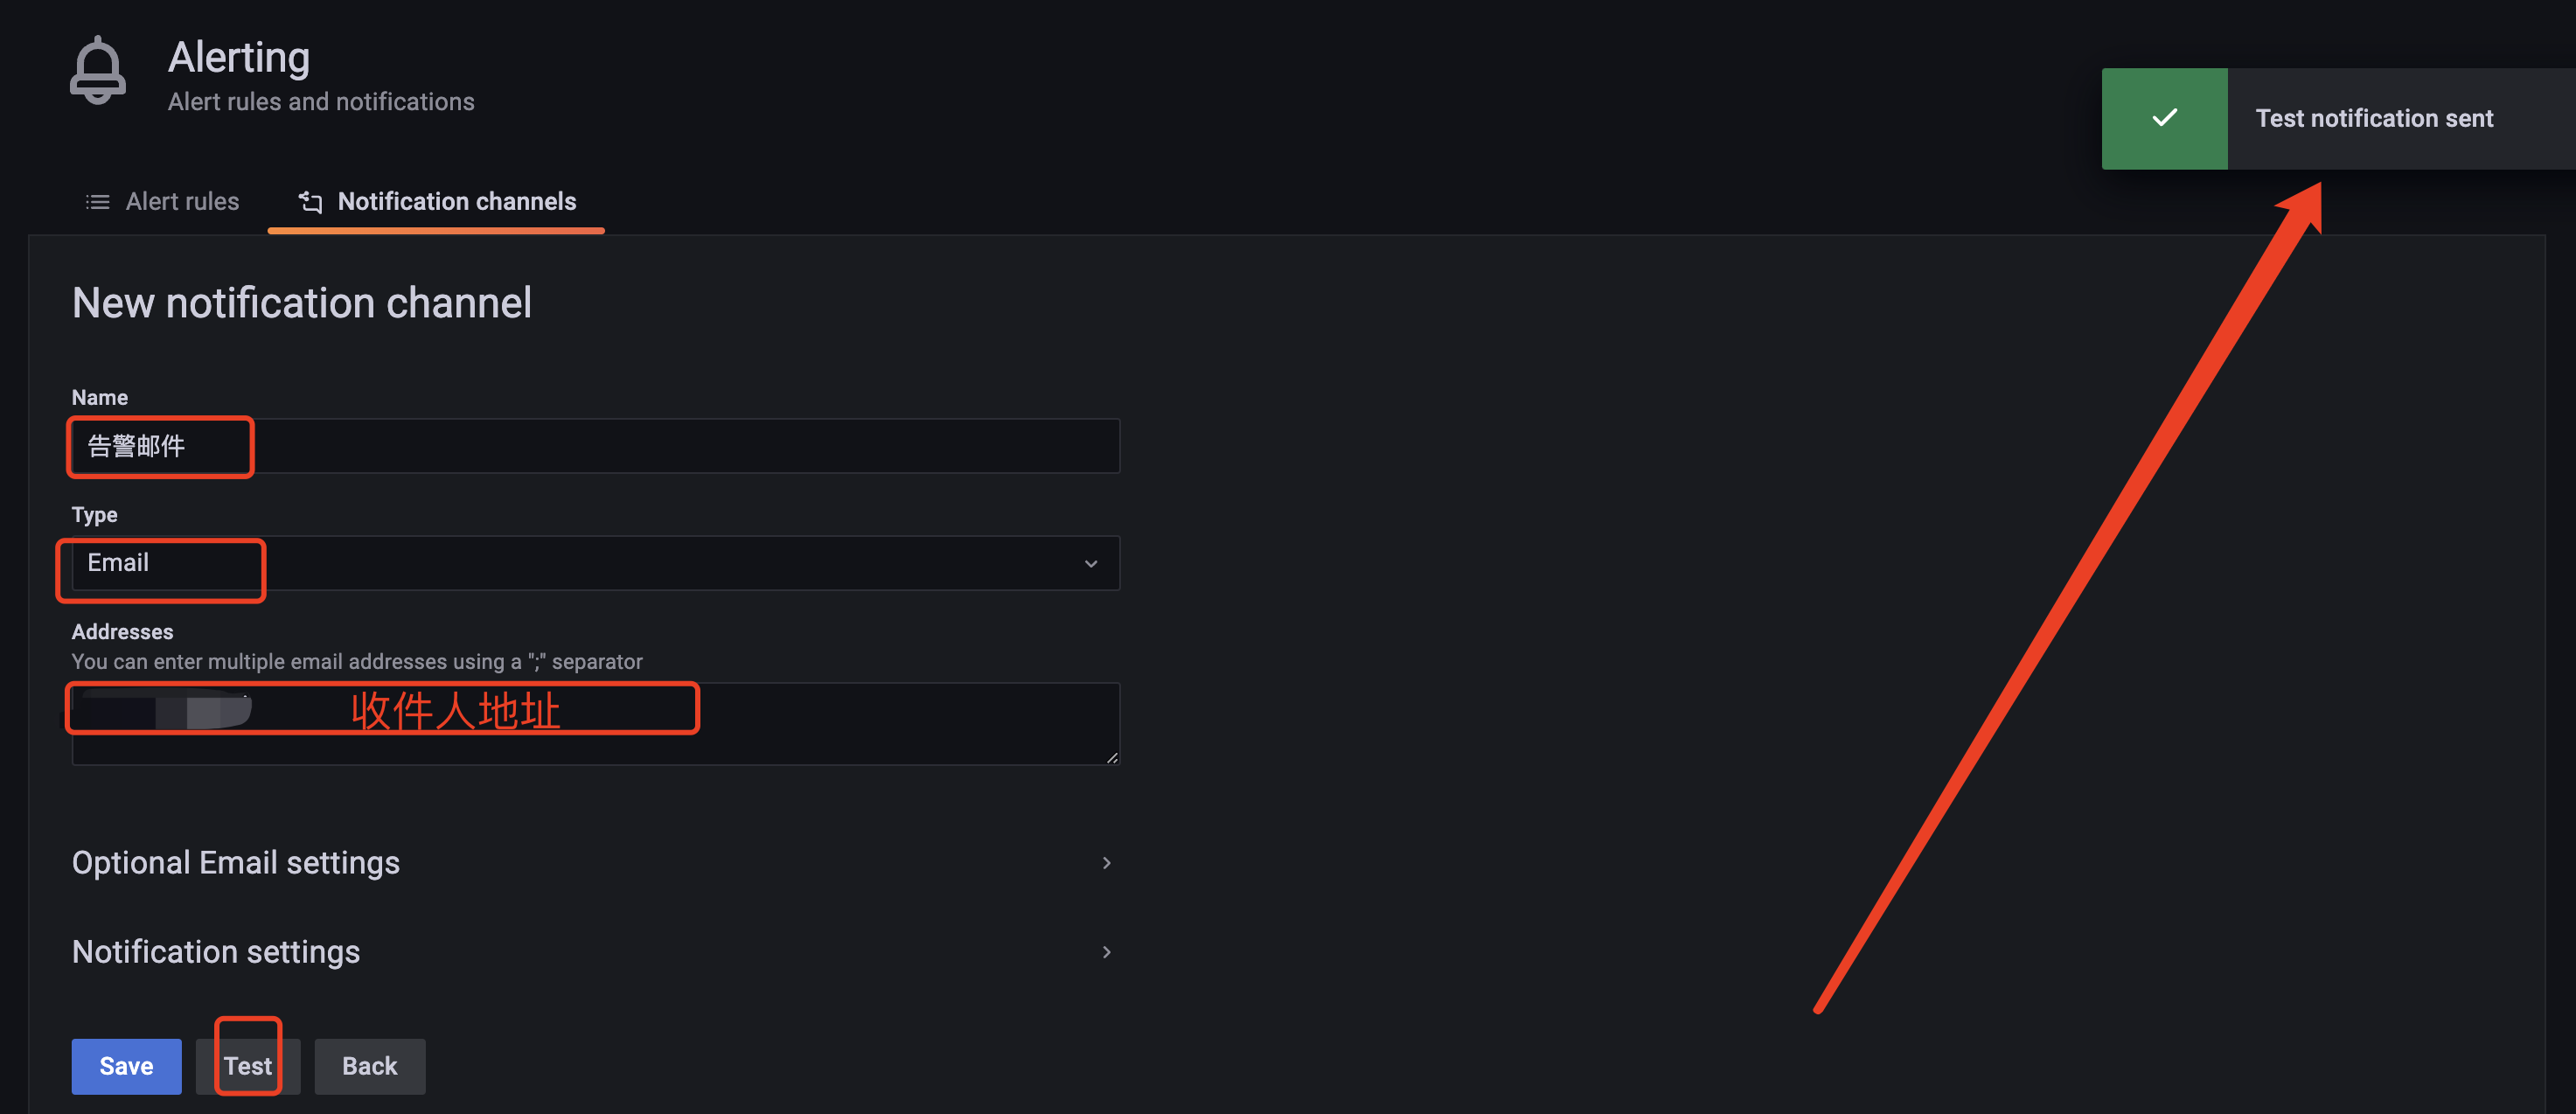
查看邮箱,邮件示例如下
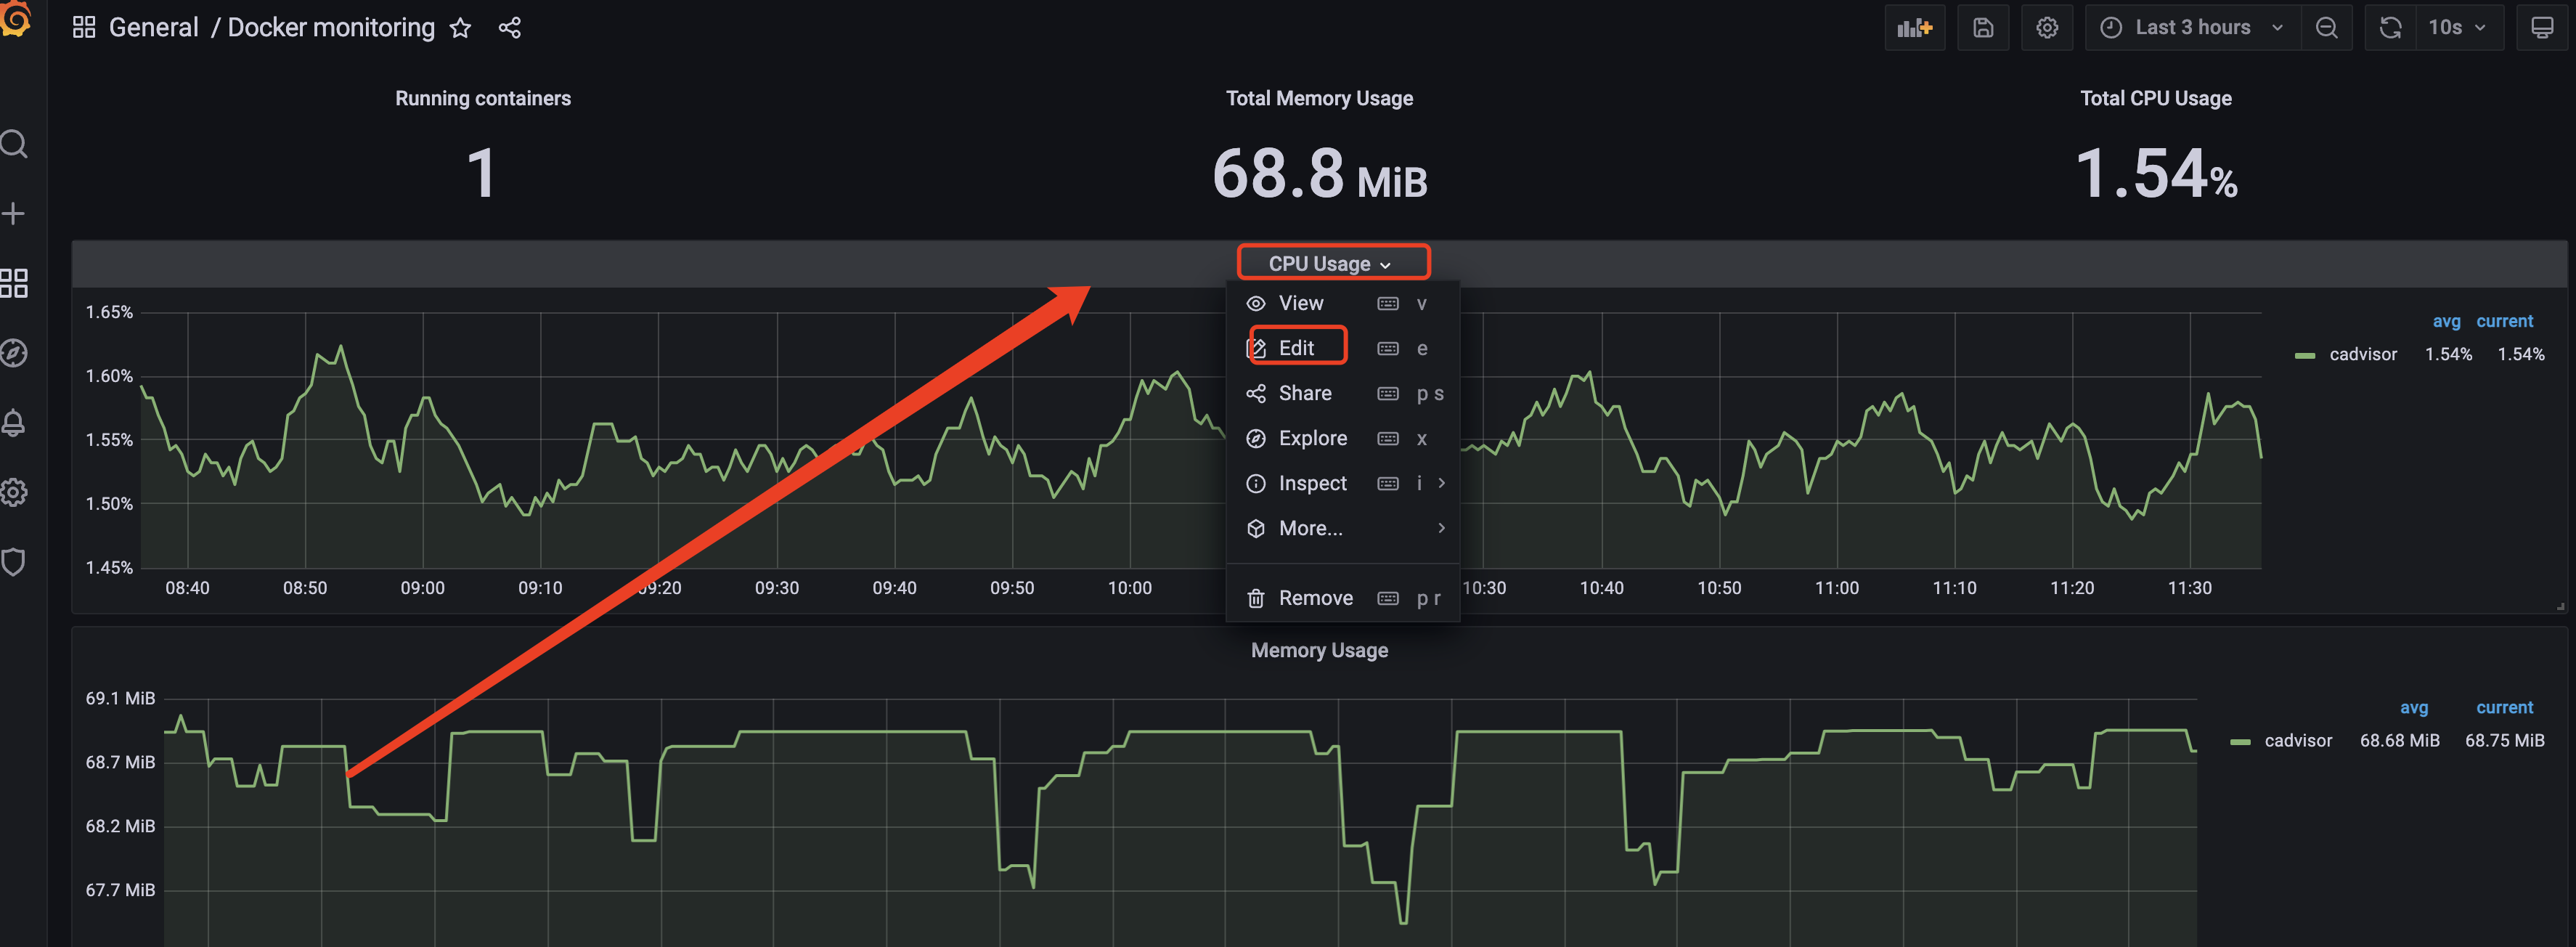
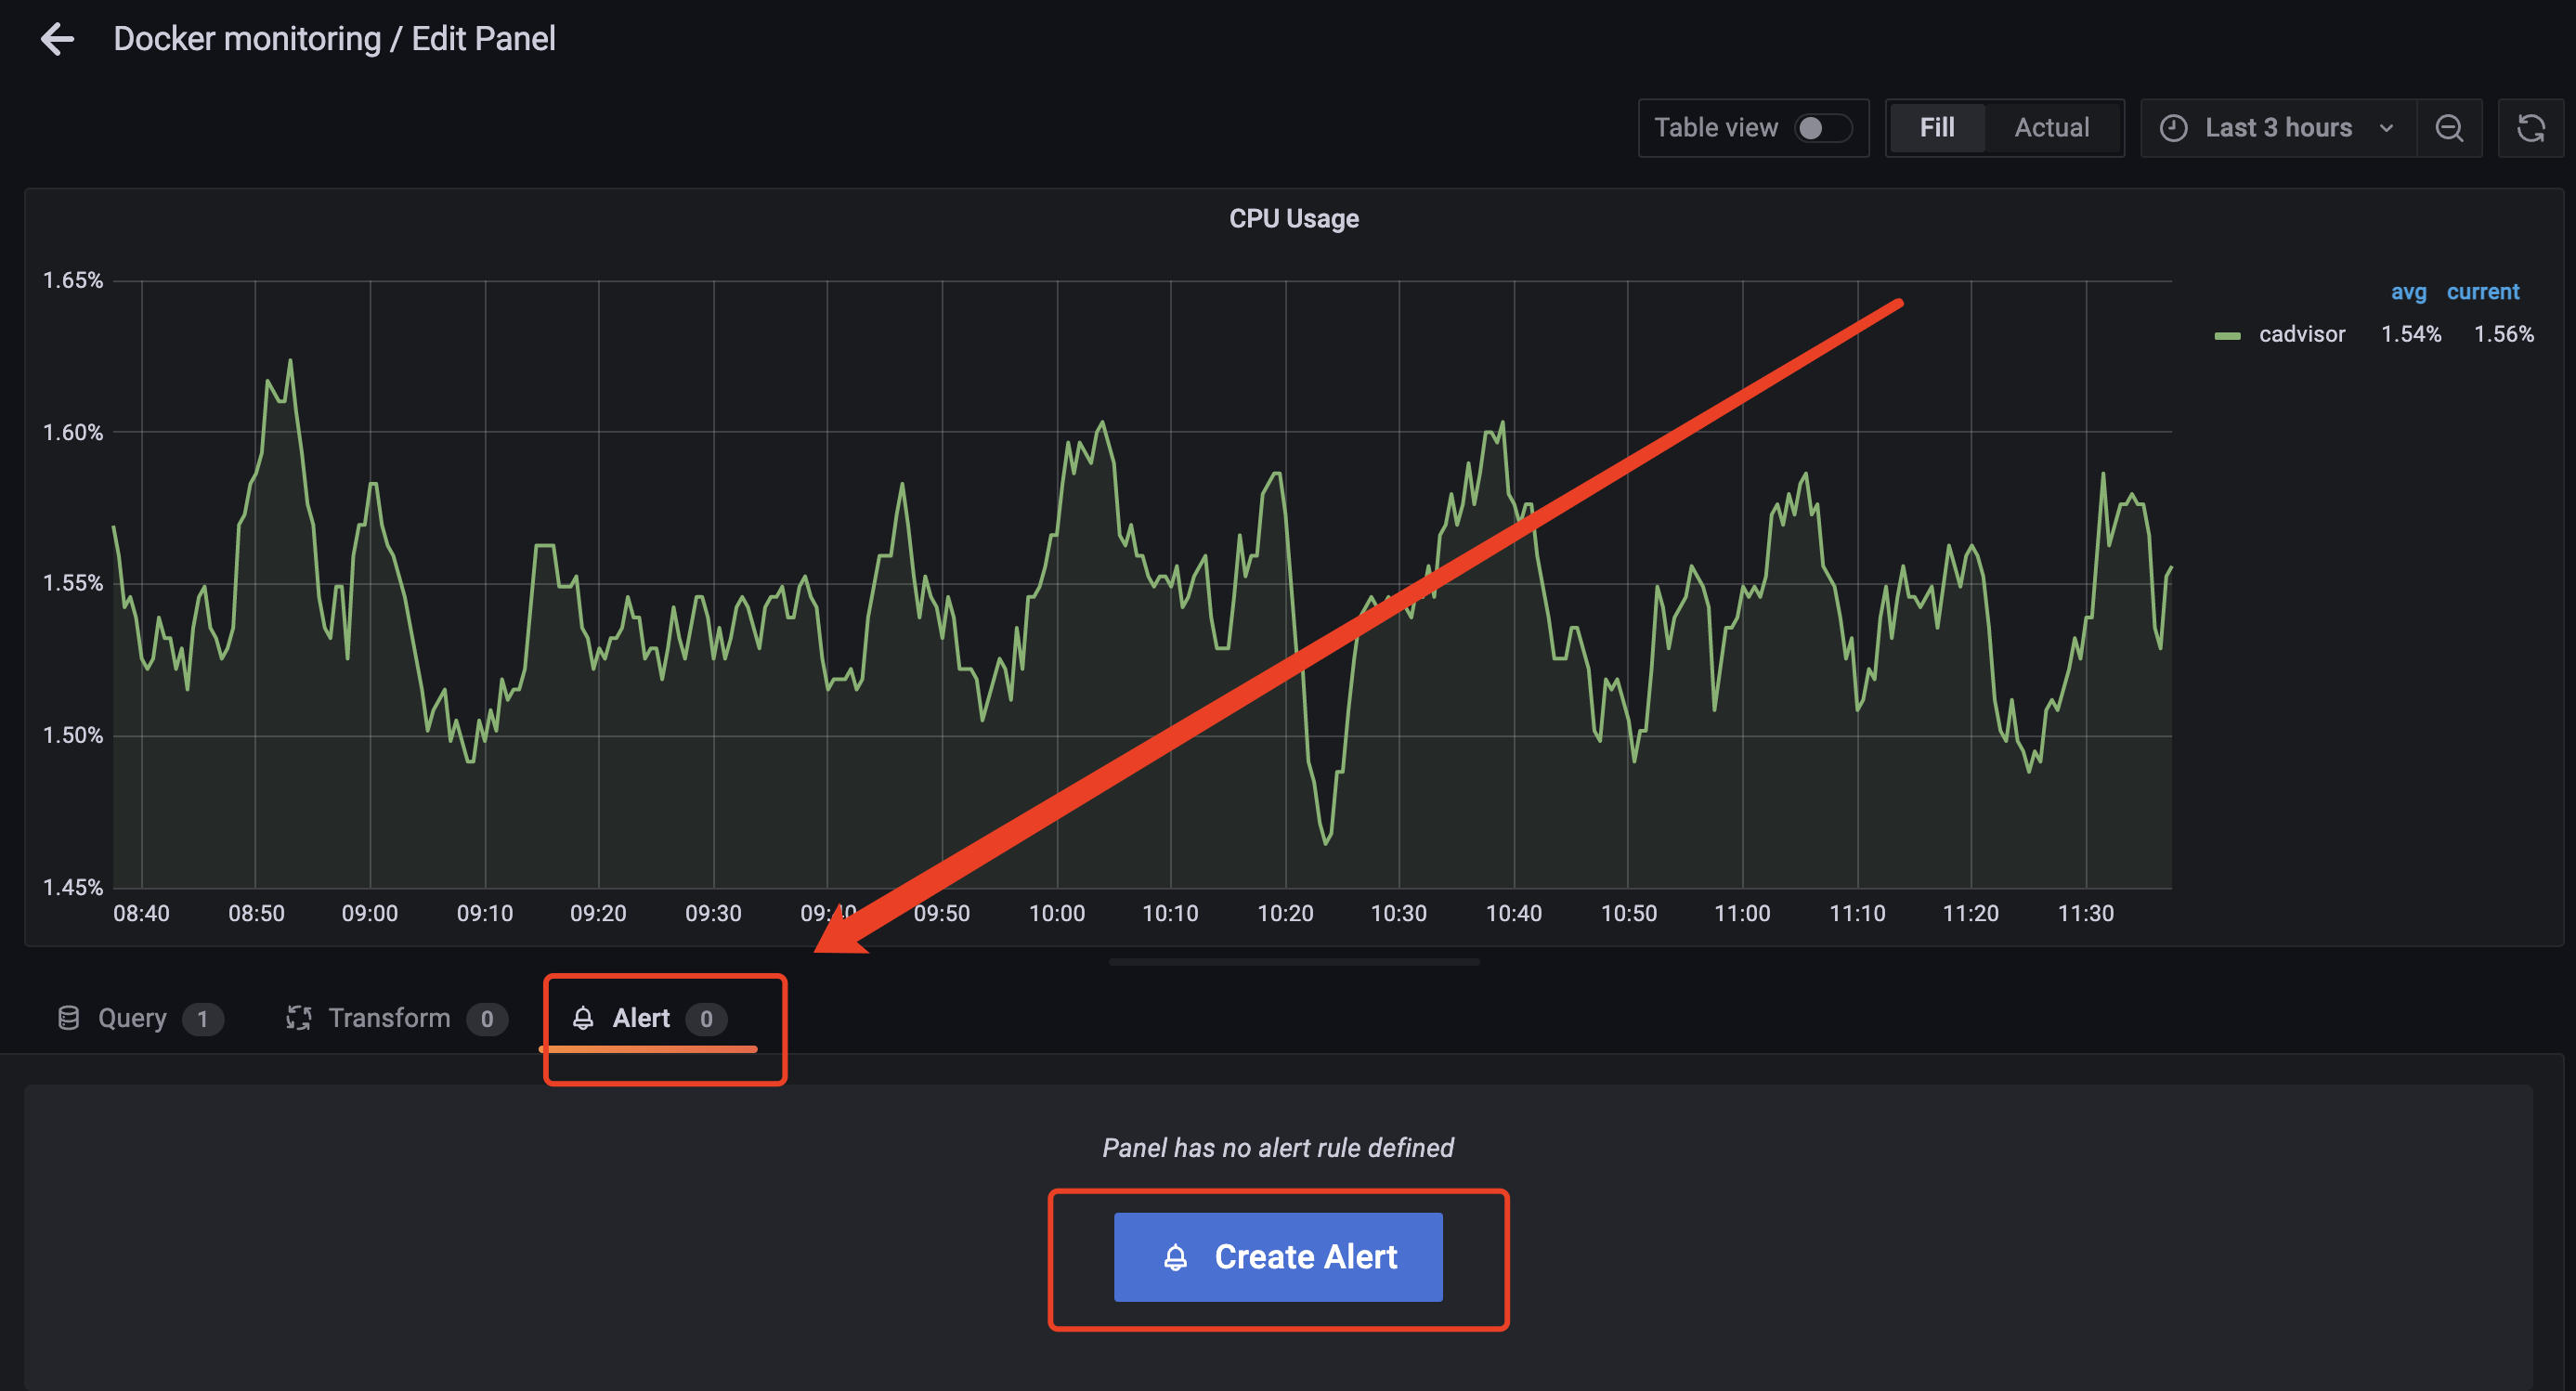
3、对监控项添加告警指标
模板的部分数据,不支持添加告警指标,可通过自定义dashboard的方式进行配置,此处以docker的相关监控项制定指标,仪表盘json文件如下


{ "__inputs": [ { "name": "DS_PROMETHEUS", "label": "prometheus", "description": "prometheus with cAdvisor as a target", "type": "datasource", "pluginId": "prometheus", "pluginName": "Prometheus" } ], "__requires": [ { "type": "panel", "id": "singlestat", "name": "Singlestat", "version": "" }, { "type": "panel", "id": "graph", "name": "Graph", "version": "" }, { "type": "grafana", "id": "grafana", "name": "Grafana", "version": "3.1.0" }, { "type": "datasource", "id": "prometheus", "name": "Prometheus", "version": "1.0.0" } ], "id": null, "title": "Docker monitoring", "description": "Docker monitoring with Prometheus and cAdvisor", "tags": [ "docker" ], "style": "dark", "timezone": "browser", "editable": true, "hideControls": false, "sharedCrosshair": true, "rows": [ { "collapse": false, "editable": true, "height": "50", "panels": [ { "cacheTimeout": null, "colorBackground": false, "colorValue": false, "colors": [ "rgba(245, 54, 54, 0.9)", "rgba(237, 129, 40, 0.89)", "rgba(50, 172, 45, 0.97)" ], "datasource": "${DS_PROMETHEUS}", "editable": true, "error": false, "format": "none", "gauge": { "maxValue": 100, "minValue": 0, "show": false, "thresholdLabels": false, "thresholdMarkers": true }, "height": "20", "id": 7, "interval": null, "isNew": true, "links": [], "mappingType": 1, "mappingTypes": [ { "name": "value to text", "value": 1 }, { "name": "range to text", "value": 2 } ], "maxDataPoints": 100, "nullPointMode": "connected", "nullText": null, "postfix": "", "postfixFontSize": "50%", "prefix": "", "prefixFontSize": "50%", "rangeMaps": [ { "from": "null", "text": "N/A", "to": "null" } ], "span": 4, "sparkline": { "fillColor": "rgba(31, 118, 189, 0.18)", "full": false, "lineColor": "rgb(31, 120, 193)", "show": false }, "targets": [ { "expr": "count(container_last_seen{image!=\"\"})", "intervalFactor": 2, "legendFormat": "", "metric": "container_last_seen", "refId": "A", "step": 240 } ], "thresholds": "", "title": "Running containers", "transparent": true, "type": "singlestat", "valueFontSize": "80%", "valueMaps": [ { "op": "=", "text": "N/A", "value": "null" } ], "valueName": "avg" }, { "cacheTimeout": null, "colorBackground": false, "colorValue": false, "colors": [ "rgba(245, 54, 54, 0.9)", "rgba(237, 129, 40, 0.89)", "rgba(50, 172, 45, 0.97)" ], "datasource": "${DS_PROMETHEUS}", "editable": true, "error": false, "format": "mbytes", "gauge": { "maxValue": 100, "minValue": 0, "show": false, "thresholdLabels": false, "thresholdMarkers": true }, "height": "20", "id": 5, "interval": null, "isNew": true, "links": [], "mappingType": 1, "mappingTypes": [ { "name": "value to text", "value": 1 }, { "name": "range to text", "value": 2 } ], "maxDataPoints": 100, "nullPointMode": "connected", "nullText": null, "postfix": "", "postfixFontSize": "50%", "prefix": "", "prefixFontSize": "50%", "rangeMaps": [ { "from": "null", "text": "N/A", "to": "null" } ], "span": 4, "sparkline": { "fillColor": "rgba(31, 118, 189, 0.18)", "full": false, "lineColor": "rgb(31, 120, 193)", "show": false }, "targets": [ { "expr": "sum(container_memory_usage_bytes{image!=\"\"})/1024/1024", "intervalFactor": 2, "legendFormat": "", "metric": "container_memory_usage_bytes", "refId": "A", "step": 240 } ], "thresholds": "", "title": "Total Memory Usage", "transparent": true, "type": "singlestat", "valueFontSize": "80%", "valueMaps": [ { "op": "=", "text": "N/A", "value": "null" } ], "valueName": "current" }, { "cacheTimeout": null, "colorBackground": false, "colorValue": false, "colors": [ "rgba(245, 54, 54, 0.9)", "rgba(237, 129, 40, 0.89)", "rgba(50, 172, 45, 0.97)" ], "datasource": "${DS_PROMETHEUS}", "editable": true, "error": false, "format": "percent", "gauge": { "maxValue": 100, "minValue": 0, "show": false, "thresholdLabels": false, "thresholdMarkers": true }, "height": "20", "id": 6, "interval": null, "isNew": true, "links": [], "mappingType": 1, "mappingTypes": [ { "name": "value to text", "value": 1 }, { "name": "range to text", "value": 2 } ], "maxDataPoints": 100, "nullPointMode": "connected", "nullText": null, "postfix": "", "postfixFontSize": "50%", "prefix": "", "prefixFontSize": "50%", "rangeMaps": [ { "from": "null", "text": "N/A", "to": "null" } ], "span": 4, "sparkline": { "fillColor": "rgba(31, 118, 189, 0.18)", "full": false, "lineColor": "rgb(31, 120, 193)", "show": false }, "targets": [ { "expr": "sum(rate(container_cpu_user_seconds_total{image!=\"\"}[5m]) * 100)", "intervalFactor": 2, "legendFormat": "", "metric": "container_memory_usage_bytes", "refId": "A", "step": 240 } ], "thresholds": "", "title": "Total CPU Usage", "transparent": true, "type": "singlestat", "valueFontSize": "80%", "valueMaps": [ { "op": "=", "text": "N/A", "value": "null" } ], "valueName": "current" } ], "title": "New row" }, { "collapse": false, "editable": true, "height": "250px", "panels": [ { "aliasColors": {}, "bars": false, "datasource": "${DS_PROMETHEUS}", "decimals": 2, "editable": true, "error": false, "fill": 1, "grid": { "threshold1": null, "threshold1Color": "rgba(216, 200, 27, 0.27)", "threshold2": null, "threshold2Color": "rgba(234, 112, 112, 0.22)" }, "id": 2, "isNew": true, "legend": { "alignAsTable": true, "avg": true, "current": true, "max": false, "min": false, "rightSide": true, "show": true, "total": false, "values": true }, "lines": true, "linewidth": 2, "links": [], "nullPointMode": "connected", "percentage": false, "pointradius": 5, "points": false, "renderer": "flot", "seriesOverrides": [], "span": 12, "stack": false, "steppedLine": false, "targets": [ { "expr": "rate(container_cpu_user_seconds_total{image!=\"\"}[5m]) * 100", "intervalFactor": 2, "legendFormat": "{{name}}", "metric": "cpu", "refId": "A", "step": 10 } ], "timeFrom": null, "timeShift": null, "title": "CPU Usage", "tooltip": { "msResolution": false, "shared": true, "sort": 0, "value_type": "cumulative" }, "transparent": false, "type": "graph", "xaxis": { "show": true }, "yaxes": [ { "format": "percent", "label": null, "logBase": 1, "max": null, "min": null, "show": true }, { "format": "short", "label": null, "logBase": 1, "max": null, "min": null, "show": true } ] } ], "title": "Row" }, { "collapse": false, "editable": true, "height": "250px", "panels": [ { "aliasColors": {}, "bars": false, "datasource": "${DS_PROMETHEUS}", "decimals": 2, "editable": true, "error": false, "fill": 1, "grid": { "threshold1": null, "threshold1Color": "rgba(216, 200, 27, 0.27)", "threshold2": null, "threshold2Color": "rgba(234, 112, 112, 0.22)" }, "id": 1, "isNew": true, "legend": { "alignAsTable": true, "avg": true, "current": true, "max": false, "min": false, "rightSide": true, "show": true, "total": false, "values": true }, "lines": true, "linewidth": 2, "links": [], "nullPointMode": "connected", "percentage": false, "pointradius": 5, "points": false, "renderer": "flot", "seriesOverrides": [], "span": 12, "stack": false, "steppedLine": false, "targets": [ { "expr": "container_memory_usage_bytes{image!=\"\"}", "hide": false, "intervalFactor": 2, "legendFormat": "{{name}}", "metric": "container_memory_usage_bytes", "refId": "A", "step": 10 } ], "timeFrom": null, "timeShift": null, "title": "Memory Usage", "tooltip": { "msResolution": false, "shared": true, "sort": 0, "value_type": "cumulative" }, "transparent": false, "type": "graph", "xaxis": { "show": true }, "yaxes": [ { "format": "bytes", "label": "", "logBase": 1, "max": null, "min": null, "show": true }, { "format": "short", "label": null, "logBase": 1, "max": null, "min": null, "show": false } ] } ], "title": "New row" }, { "collapse": false, "editable": true, "height": "250px", "panels": [ { "aliasColors": {}, "bars": false, "datasource": "${DS_PROMETHEUS}", "editable": true, "error": false, "fill": 1, "grid": { "threshold1": null, "threshold1Color": "rgba(216, 200, 27, 0.27)", "threshold2": null, "threshold2Color": "rgba(234, 112, 112, 0.22)" }, "id": 3, "isNew": true, "legend": { "avg": false, "current": false, "max": false, "min": false, "show": true, "total": false, "values": false }, "lines": true, "linewidth": 2, "links": [], "nullPointMode": "connected", "percentage": false, "pointradius": 5, "points": false, "renderer": "flot", "seriesOverrides": [], "span": 6, "stack": false, "steppedLine": false, "targets": [ { "expr": "irate(container_network_receive_bytes_total{image!=\"\"}[5m])", "intervalFactor": 2, "legendFormat": "{{name}}", "metric": "container_network_receive_bytes_total", "refId": "A", "step": 20 } ], "timeFrom": null, "timeShift": null, "title": "Network Rx", "tooltip": { "msResolution": false, "shared": true, "sort": 0, "value_type": "cumulative" }, "type": "graph", "xaxis": { "show": true }, "yaxes": [ { "format": "Bps", "label": null, "logBase": 1, "max": null, "min": null, "show": true }, { "format": "short", "label": null, "logBase": 1, "max": null, "min": null, "show": true } ] }, { "aliasColors": {}, "bars": false, "datasource": "${DS_PROMETHEUS}", "editable": true, "error": false, "fill": 1, "grid": { "threshold1": null, "threshold1Color": "rgba(216, 200, 27, 0.27)", "threshold2": null, "threshold2Color": "rgba(234, 112, 112, 0.22)" }, "id": 4, "isNew": true, "legend": { "avg": false, "current": false, "max": false, "min": false, "show": true, "total": false, "values": false }, "lines": true, "linewidth": 2, "links": [], "nullPointMode": "connected", "percentage": false, "pointradius": 5, "points": false, "renderer": "flot", "seriesOverrides": [], "span": 6, "stack": false, "steppedLine": false, "targets": [ { "expr": "irate(container_network_transmit_bytes_total{image!=\"\"}[5m])", "intervalFactor": 2, "legendFormat": "{{name}}", "refId": "A", "step": 20 } ], "timeFrom": null, "timeShift": null, "title": "Network Tx", "tooltip": { "msResolution": false, "shared": true, "sort": 0, "value_type": "cumulative" }, "type": "graph", "xaxis": { "show": true }, "yaxes": [ { "format": "Bps", "label": null, "logBase": 1, "max": null, "min": null, "show": true }, { "format": "short", "label": null, "logBase": 1, "max": null, "min": null, "show": true } ] } ], "title": "New row" } ], "time": { "from": "now-3h", "to": "now" }, "timepicker": { "refresh_intervals": [ "5s", "10s", "30s", "1m", "5m", "15m", "30m", "1h", "2h", "1d" ], "time_options": [ "5m", "15m", "1h", "6h", "12h", "24h", "2d", "7d", "30d" ] }, "templating": { "list": [] }, "annotations": { "list": [] }, "refresh": "10s", "schemaVersion": 12, "version": 26, "links": [], "gnetId": 193 }
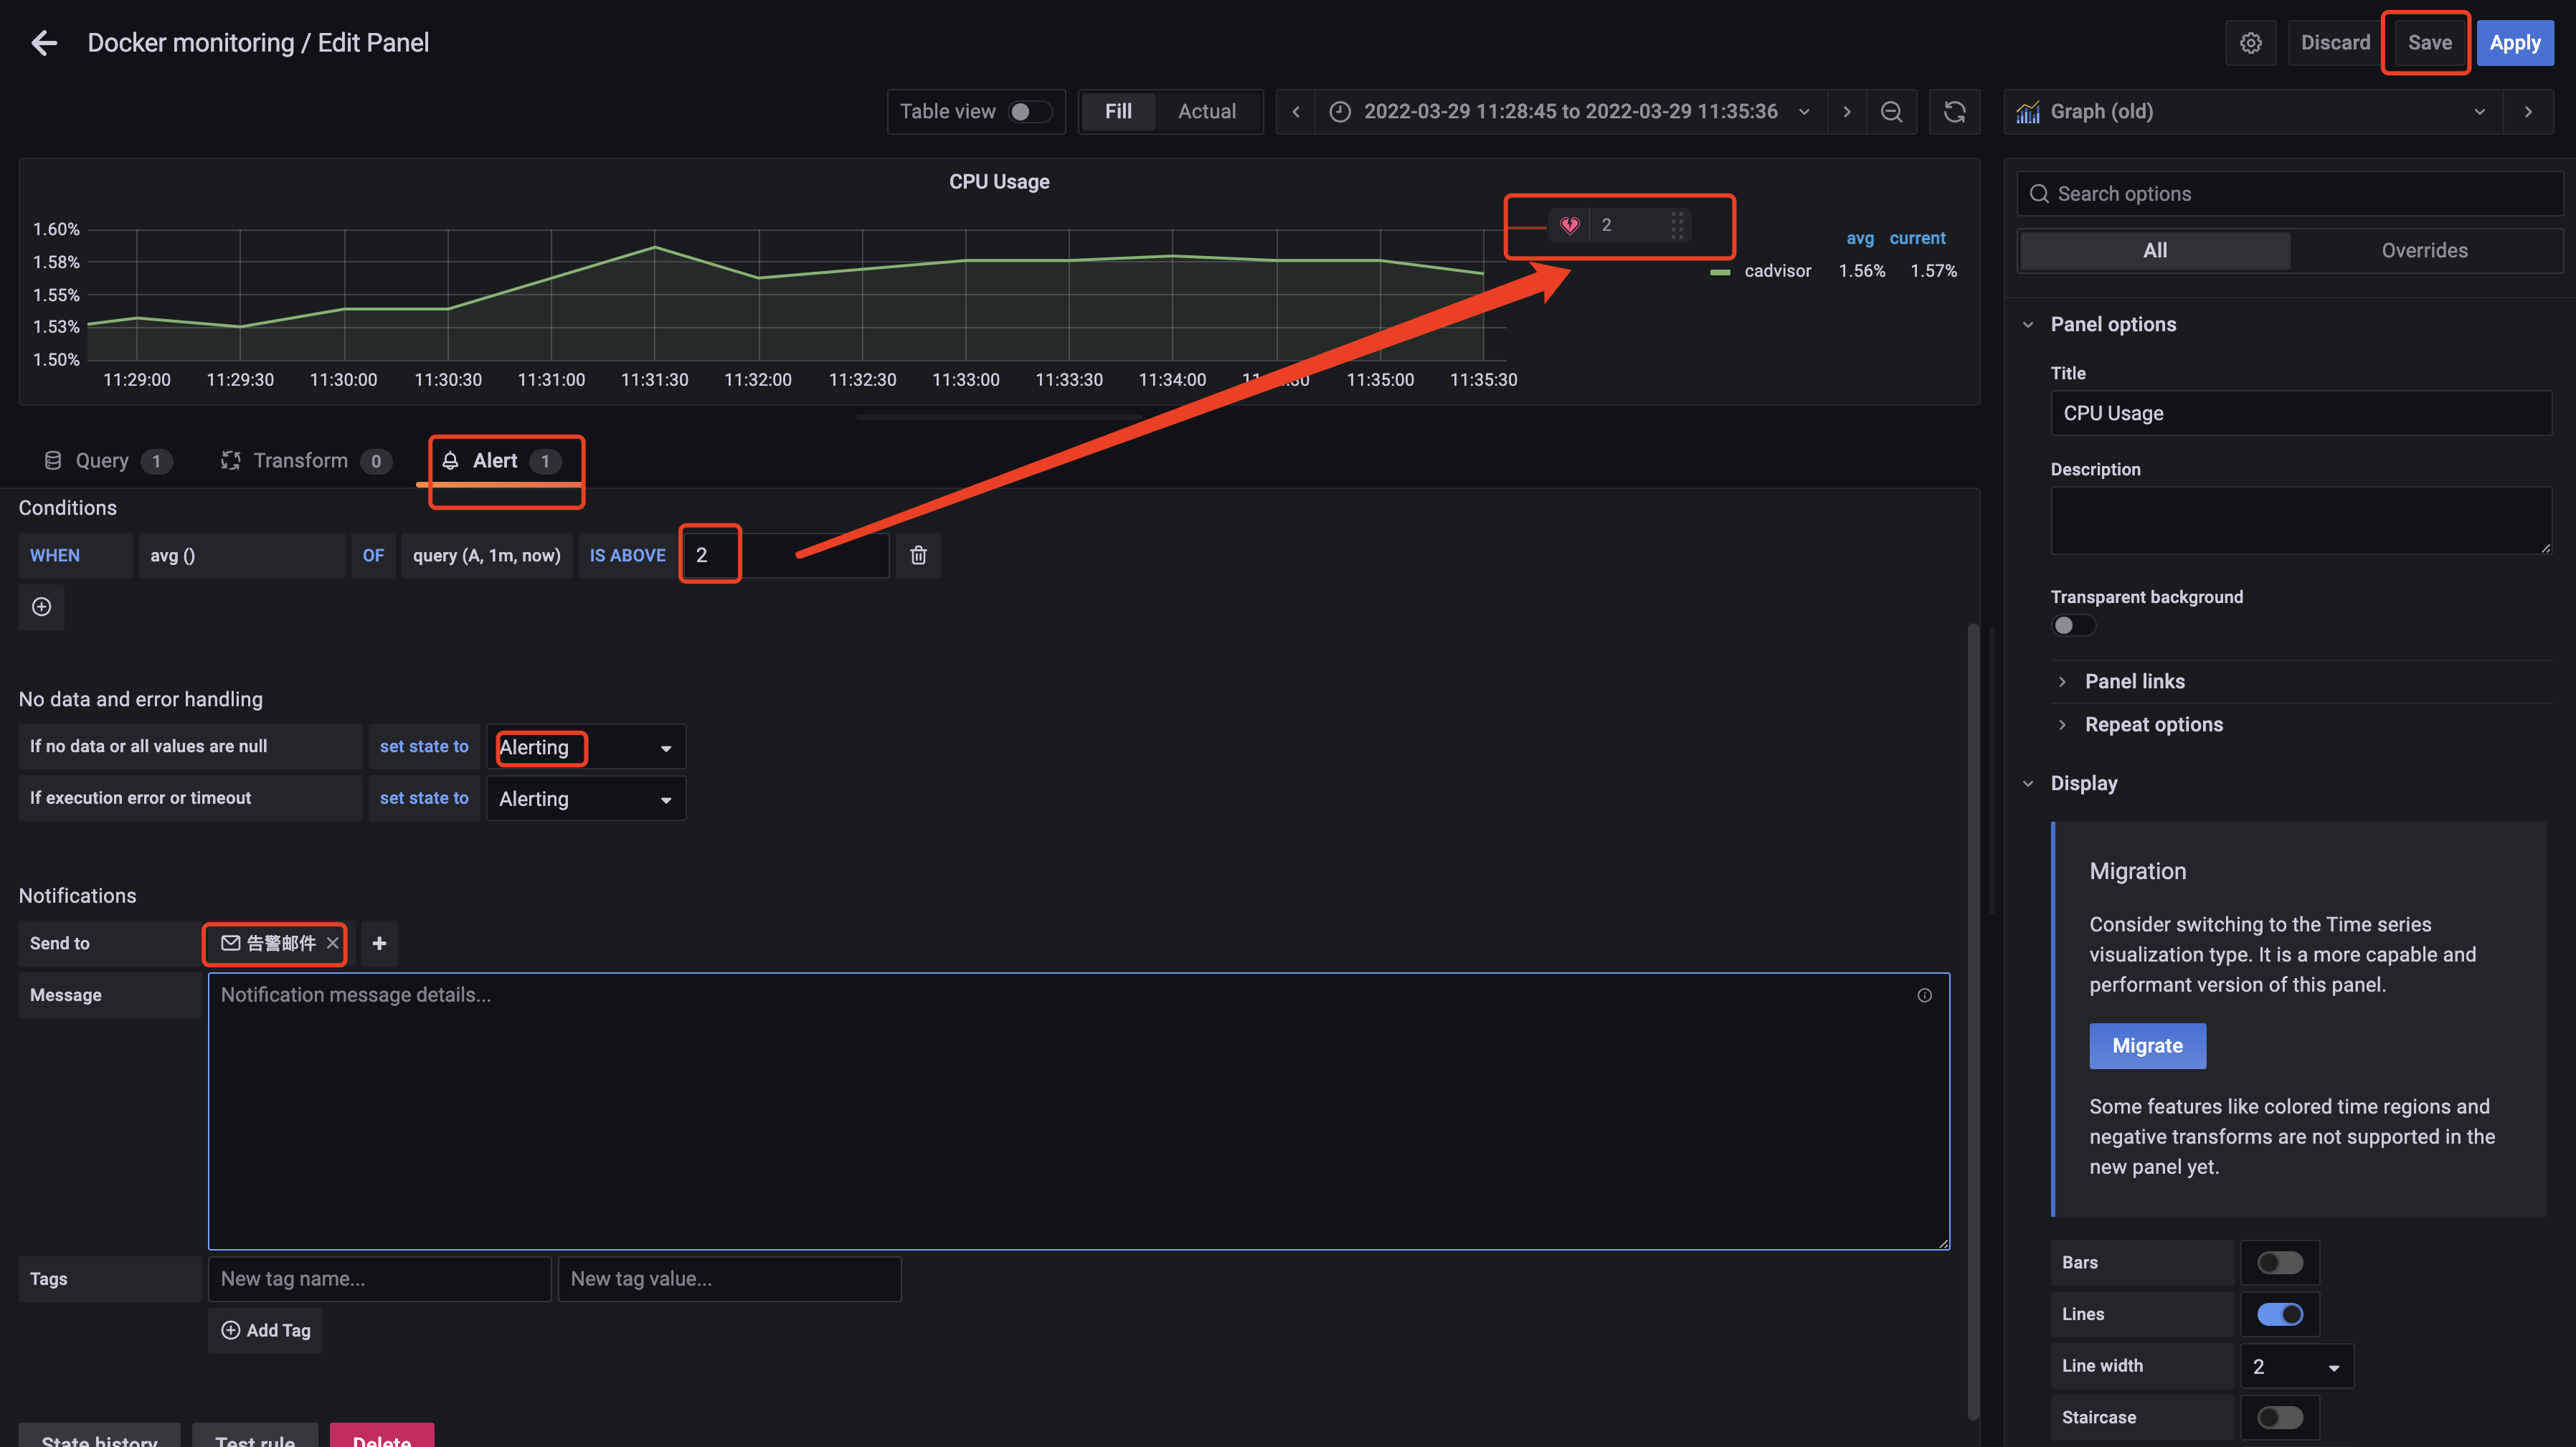
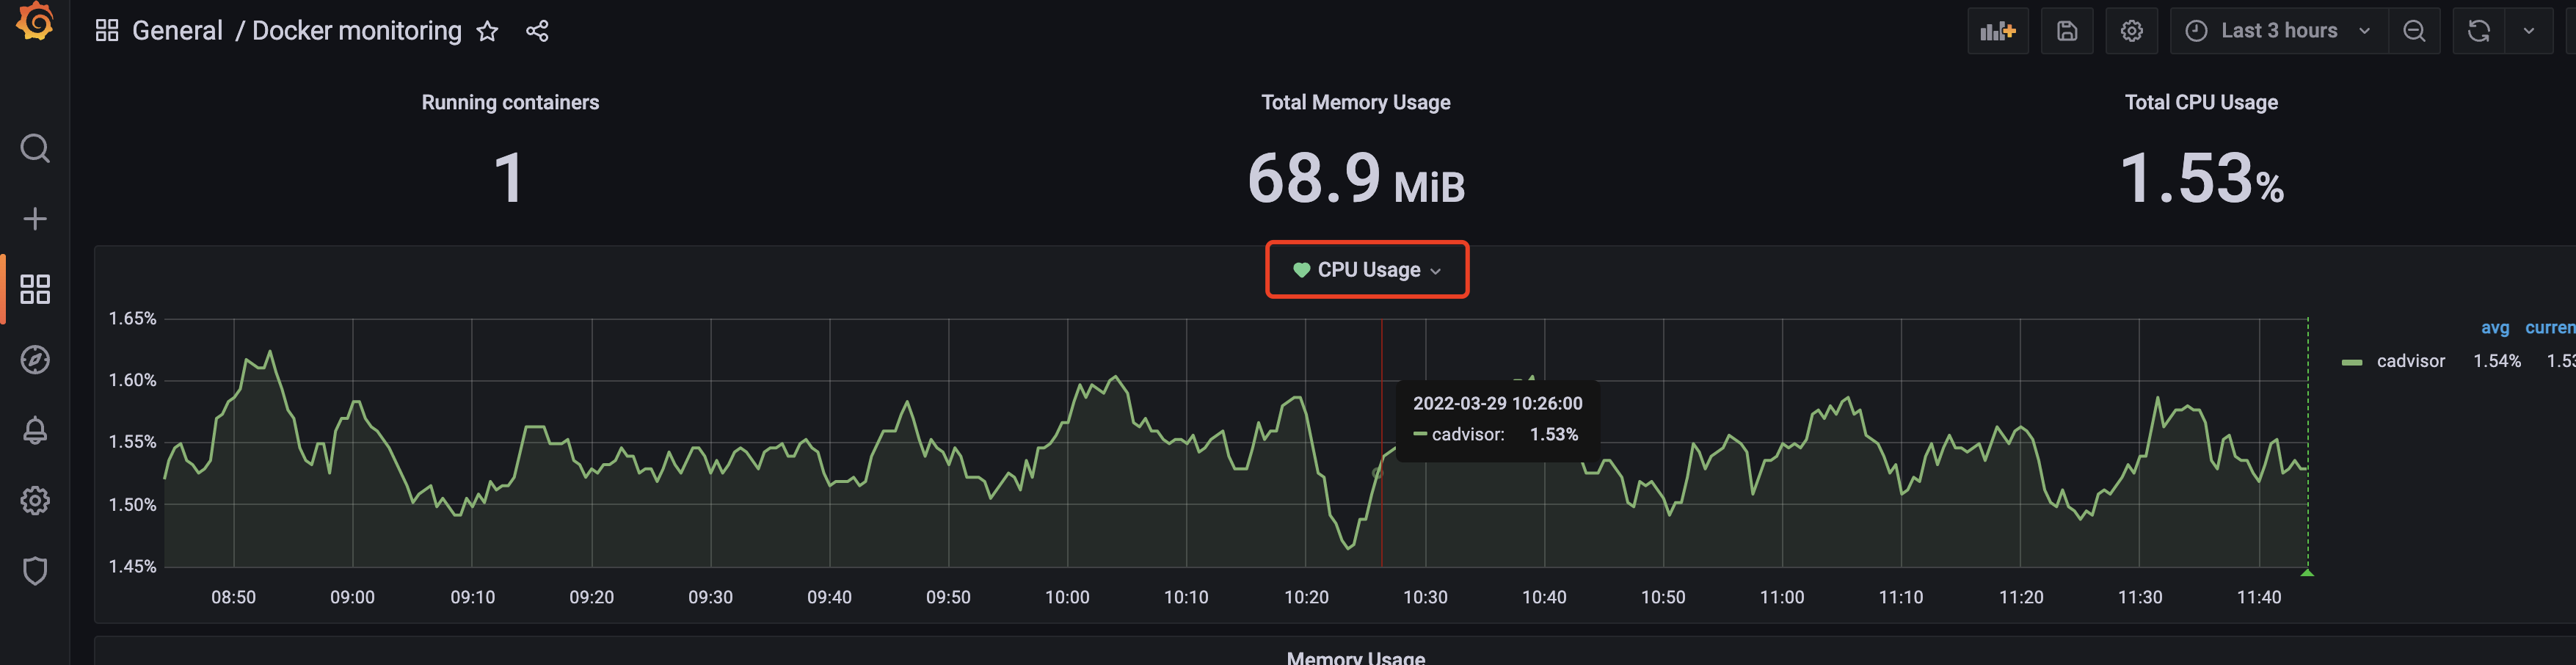
按照图中配置完相关参数之后,点击右上角的save按钮进行保存,然后返回到仪表盘的首页面,可看到监控项名称旁多了一个小❤️,如下图
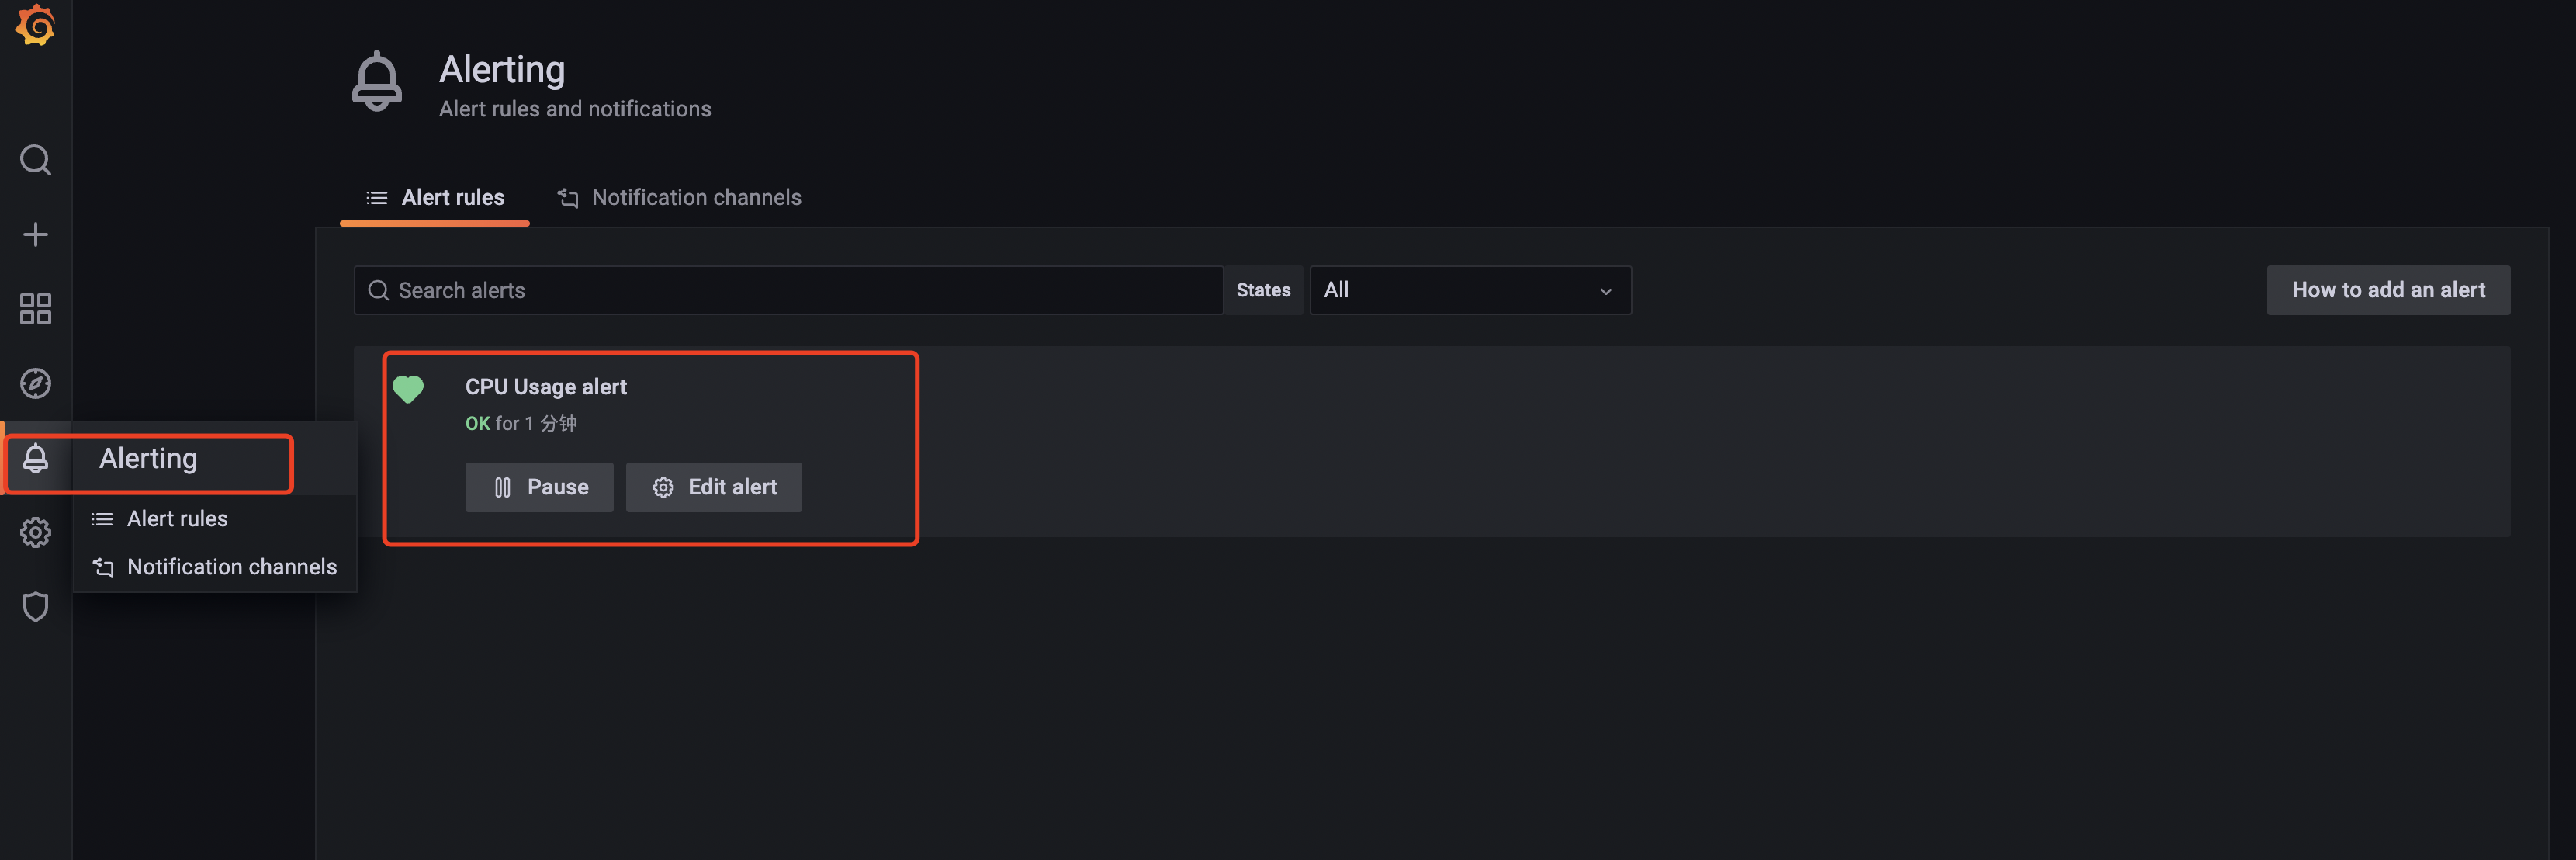
也可以在alert里面对监控指标进行管理,如下图
至此,grafana对监控项配置邮件告警就完成了。

