SIFT算法
首先感谢 会飞的吴克 在B站中的教学视频,本篇博客只用于交流学习
在这里贴出参考教学视频的网址SIFT(尺度不变特征变换)
下面所有标红的部分都是目前暂时不是很理解的部分,等待后面有时间必须将这一部分了解透彻
SIFT过程
1建立高斯差分金字塔
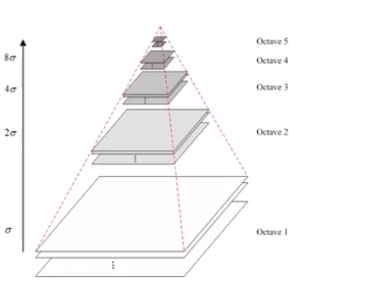
图1
首先如图1所示,这是高斯金字塔。我们可以看到其是由很多组组成,每一组包含很多层,其中每一组的层代表的是一张照片,每一组的照片的大小尺寸是相同的。
可以使用不同的方差计算高斯核
用不同的方差的高斯核对原图片进行卷积就能得到第一组的所有层,也就是图1中最下面的Octave1组,也就是第一组的每一层都是由不同尺度方差的高斯核计算得到的。
第二层的初始第一张图片是由第一组的图片进行降采样得到的。降采样就是隔点取点,也就是第一个像素点留下,第二个去掉,第三个留下,第四个去掉,依次这么做,最后第二层的图片的长宽都是第一层的1/2,之后再用不同尺度的高斯核进行卷积。之后的每一组都是这么顺序操作。这样得到的图1就是高斯金字塔,这个金字塔也可以叫做尺度空间。
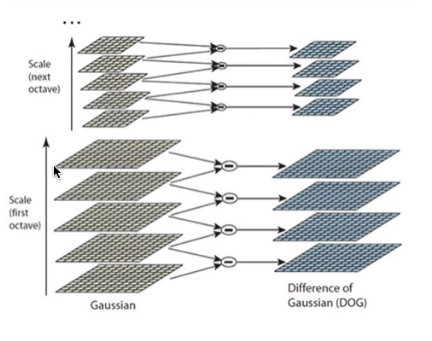
图2
在得到的图1的高斯金字塔上的同一组的每一层相减,就是单纯对应位置的四则减法运算,得到的就是高斯差分金字塔,如图2所示。
对于高斯金字塔中应该由多少组,每组应该有多少层,算法的发明者在论文中的建议值为
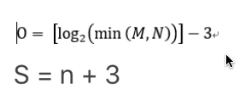
图3
如图3所示,o表示多少组,M N表示原图片的长和宽,S是层数
n表示希望提取几个尺度的极值点(具体意义和作用暂不理解知道)
S=n+3的由来是:
在图2中S=5,所以只能提取到两张图片中的特征,找特征点实际上是在高斯差分金字塔中进行寻找,此时高斯差分金字塔中是4张图片,在三个方向中找极值点。三个方向是图片的两个方向x y,以及尺度方向,也就是图2中的竖着的方向,因为差分金字塔的最上面一层没有向上的竖着的方向,所以无法求导,同理最下面一层也没有向下的方向,所以也无法求导,因为找极值点就是求导,无法求导就是不能寻找极值点,所以需要再减2.这样得到的n+3
为什么建立高斯金字塔,高斯差分金字塔?
SIFT应该有远近不变性,也就是不管是离着远拍还是离着仅拍,同一个物品都应该是能识别出来的。金字塔其实就是模拟的近大远小。高斯核卷积模拟的是近处清晰,远处模糊。在数学上有个证明,高斯核是唯一可以模拟近处清晰,远处模糊的线性核。
每次卷积的时候的尺度怎么定?高斯核的标准差怎么定?
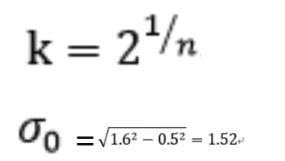
图4
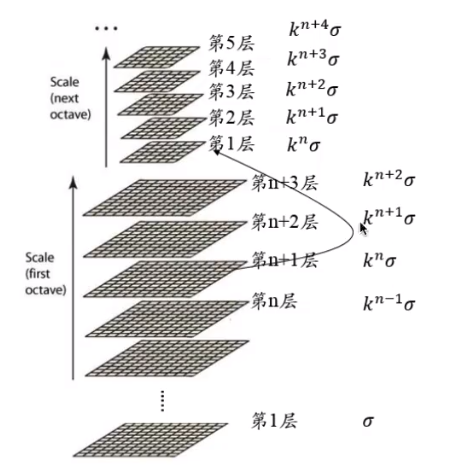
图5
由图4和图5可知,第一组的子一层是标准差0,第二层就是k标准差,依次类推。第二组的第一层是k的指数与第一组的倒数第三层一样,这个时候系数为2,也就是为了凑一个2标准差.也就是2标注差的图片隔点取点得到第二组第一层的图片。
标准差0,照相机照相的时候也不是完全清晰的,自带一个模糊尺度,认为这个尺度是0.5,希望第一次高斯核卷积之后能达到1.6,这样就出来了标准差的公式。也就是用0.5尺度卷积,再用1.52尺度卷积得到的结果与直接用1.6尺度卷积得到的效果一样。
2关键点位置的确定
关键点是稳定的点,变化少,有稳定性质的点,包含很多信息的点,这些点通常是在极值位置,可以是极大值,也可以是极小值。
2.1 阈值化

图6
首先进行阈值化,每个像素点的绝对值满足上面的要求,如果不满足,我们认为是极值点的可能性非常小。
2.2在高斯差分金字塔中找极值
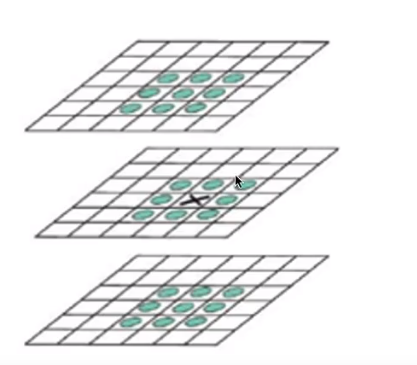
图7
图7找的极值点是离散的极值点,因为我们的空间是一个像素一个像素的,是离散的。
在图7中如果是在27个像素点中找到一个最大的,那么这就是一个离散的极值点,并不是一个真正的极值点。
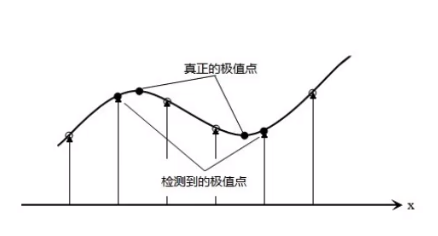
图8
按照图7极值点的求取办法是找到一个真正极值点的附近的一个点,我们需要找到一个更准确的亚像素位置的极值点。
2.3 调整极值点的位置
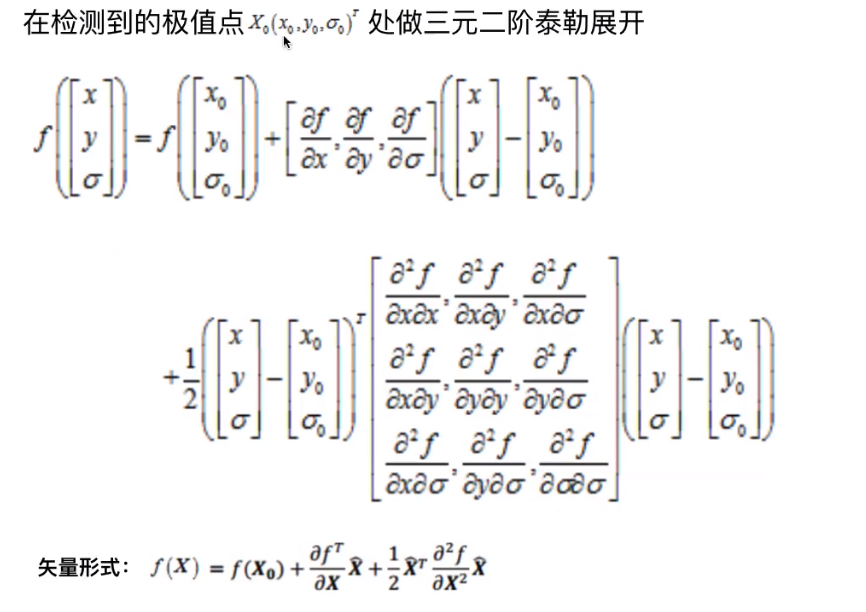
图9
上面的X0就是在图7中检测到的极值点。表示成矢量的形式是为了找到极值点的精确位置,泰勒展开的f(x)是在X0处原函数的近似,在这里就认为是原函数。
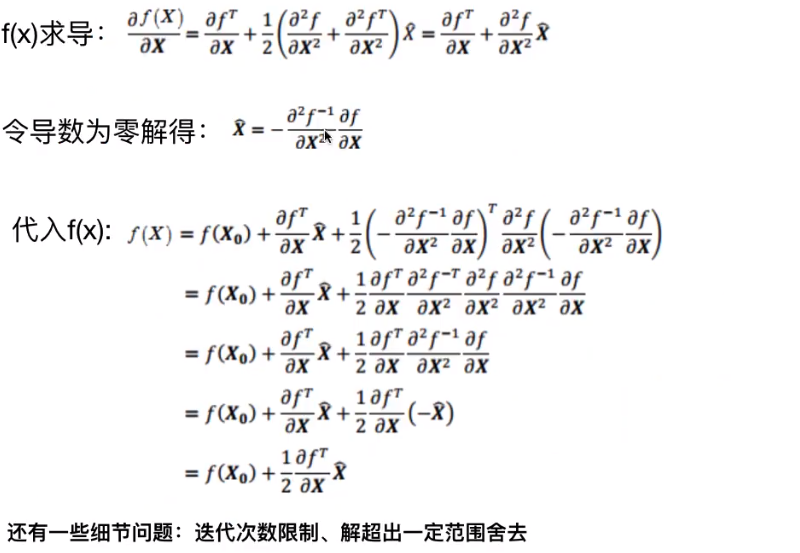
图10
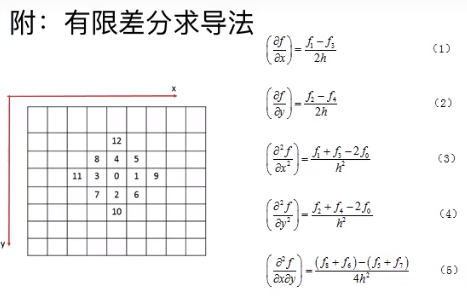
图11
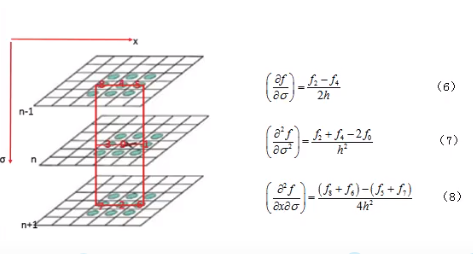
图12
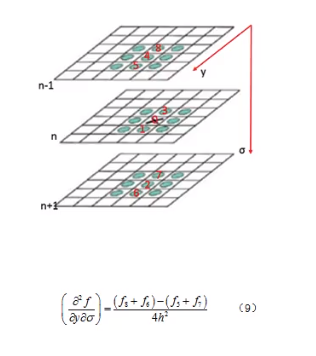
图13
如上图所示,求导使用差商来代替,例如0处对x的求导,其中f1=3,f3=1,至于h取什么值暂时无所谓。
因为X(上面图片中的X上有一个小弧线,在博客园中暂时打不出,所以之后都使用加粗倾斜的X表示)是X-X0,所以得到的解X是真正的极值点相对于检测到的极值点的位移量。最后求出的f(X)是真正极值点对应的值。
算法实现的时候是迭代的过程,会涉及一些细节问题,这里暂时不讨论,我也不太理解。
当X的三个分量都小于0.5的时候,就认为已经比较接近真正的极值点,就不需要再进行迭代了。如果超出迭代次数限制,三个分量都没有小于0.5,认为它可能收敛不了了,就直接舍去这个点。如果最后收敛了,但是解超出了一定范围(因为这个泰克展开只能在找到的极值点的附近拟合原函数),也进行舍去操作。
2.4 舍去低对比度的点

图14
如果最后的f(x)的绝对值满足图14的条件,则直接舍去。
2.5 边缘效应的去除
需要用到海森矩阵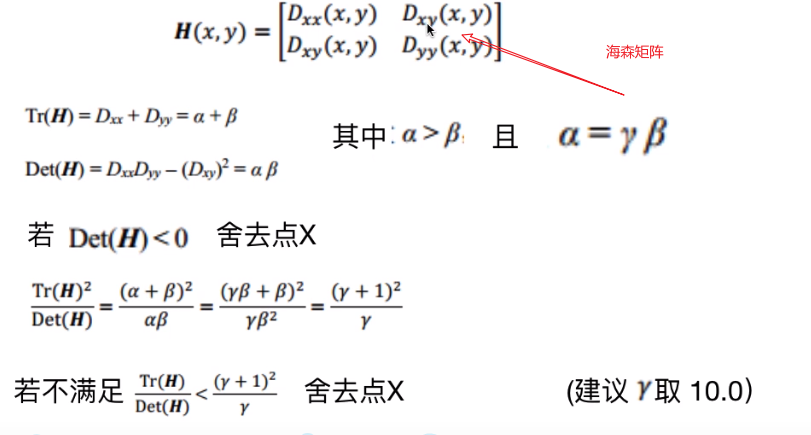
图15
海森矩阵可以描述曲线的曲率,在两个方向上的曲率差不多的时候才可以,否则很可能是一个边缘。海森矩阵的特征值和曲率成正比,这里使用Tr(H)和Set(H)来代替进行操作
其中α β就是两个特征值。
若Det(H)《0,这时特征值异号了,此时有边缘效应了。
图15最下面的Tr(H)少写一个平方
需要注意的是例如在第二层求出的极值点,映射到第一层其x 和 y分别乘2
3 为关键点赋予方向
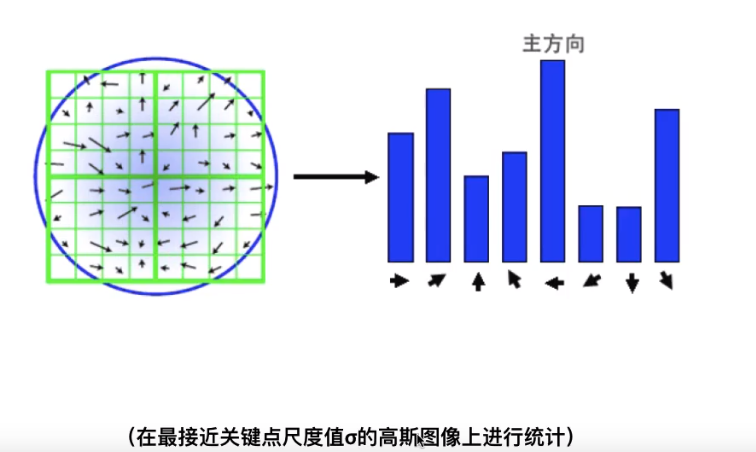
图16
统计以特征点为圆心,以该特征点所在的高斯图像的尺度1.5倍为半径的圆内的所有的像素的梯度的方向及其梯度赋值,并作1.5标准差的高斯滤波。
关键点的参数是 (x, y, 标准差),可以都不是整数,标准差也可以不落在某一层上
因为关键点的标准差可能在亚像素上,也就是并不在当前组的某一层上,所以统计的高斯图像是最接近这个标准差的某一层(在高斯金字塔中找,而不是在高斯差分金字塔中)。
统计其梯度方向和大小,方向有360°,但是最后统计成8个方向,落在那个区间就是在哪个方向。
做高斯滤波是为了越接近特征点的权重就越大
在实际的代码中分成了36个方向,每十度是一个方向,从其中选择主方向,主方向就是最后的权重最大的方向,有时也会存在一个辅方向(权重大于等于主方向的80%)
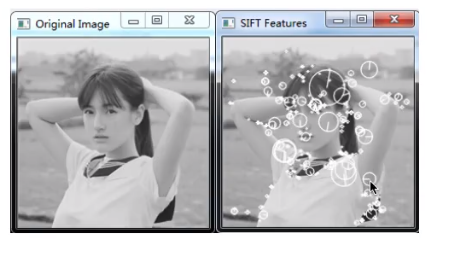
图17
此时就可以得到如图17所示的图像
提取出了一张图片中的特征点,位置代表了特征点的位置,圆圈的大小代表了尺度的大小,线代表了主方向。有两个方向就是存在一个辅方向,辅方向的处理方法是当作两个特征点进行处理。
4构建关键点描述符
关键点的参数(x,y,标准差,主方向)
在一张图片中找到关键点不算完,要在两张图片中分别找到它们的关键点,把对应的关键点进行匹配,这个时候就需要通过描述符进行匹配。
在SIT算法中描述符是一个128维的向量,也就是128个数。
使用k近邻(KNN)算法进行匹配
其实就是找最近的两个向量。
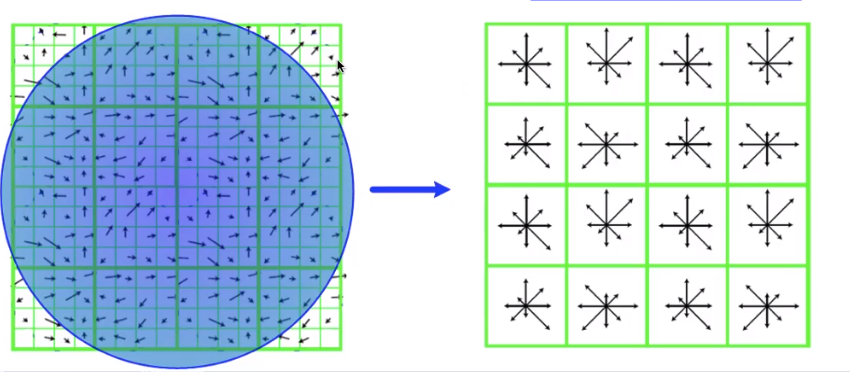
图18
在关键点周围的一个区域,如图18所示。一共分成了16个子区域,每一个最小格是一个像素。在每个子区域内统计八个方向(东、南、西、北、东北、东南、西北、西南)上的梯度(也是经过高斯加权)的长度,所以共有8*16=128个数,这128个数按照顺序写出来就是描述符
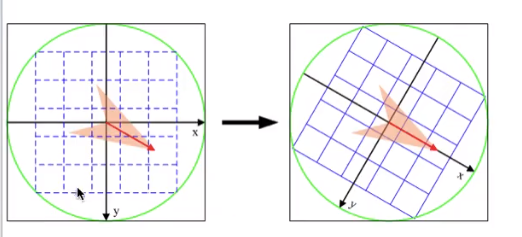
图19
图18的区域并不是直接拿关键点周围的高斯图像区域,而是首先把关键点周围的某个区域旋转到主方向上,为了SIFT的描述符具有旋转不变性(我的理解是可能比较的两张图片中其中一张存在旋转,这样我们将其区域都相对于主方向进行旋转,那么这个关键点周围区域的两张图片就是同一个方向,也就是旋转到了同一个方向),才可以得到稳定的描述符。
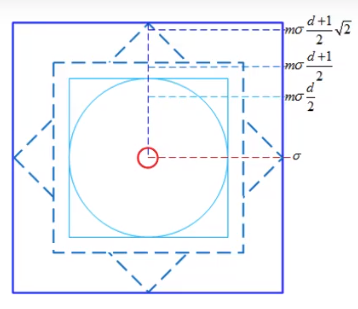
图20
图20是为了确定关键点周围区域的大小,插值的方式。
m一般取3,d有几个小区域(横着算竖着算)d=4
5程序运行结果示例

图21
如图21所示,可以将几个对应位置对应起来。
6 代码
点击查看代码
# coding: utf-8
import warnings
warnings.filterwarnings("ignore")  #忽略警告
import numpy as np
import matplotlib.pyplot as plt
from sklearn.neighbors import KNeighborsClassifier
from PIL import Image


def convolve(filter,mat,padding,strides):

    result = None
    filter_size = filter.shape
    mat_size = mat.shape
    if len(filter_size) == 2:
        if len(mat_size) == 3:
            channel = []
            for i in range(mat_size[-1]):
                pad_mat = np.pad(mat[:,:,i], ((padding[0], padding[1]), (padding[2], padding[3])), 'constant')
                temp = []
                for j in range(0,mat_size[0],strides[1]):
                    temp.append([])
                    for k in range(0,mat_size[1],strides[0]):
                        val = (filter*pad_mat[j:j+filter_size[0],k:k+filter_size[1]]).sum()
                        temp[-1].append(val)
                channel.append(np.array(temp))

            channel = tuple(channel)
            result = np.dstack(channel)
        elif len(mat_size) == 2:
            channel = []
            pad_mat = np.pad(mat, ((padding[0], padding[1]), (padding[2], padding[3])), 'constant')
            for j in range(0, mat_size[0], strides[1]):
                channel.append([])
                for k in range(0, mat_size[1], strides[0]):
                    val = (filter * pad_mat[j:j + filter_size[0],k:k + filter_size[1]]).sum()
                    channel[-1].append(val)


            result = np.array(channel)


    return result


def downsample(img,step = 2):
    return img[::step,::step]

def GuassianKernel(sigma , dim):
    '''
    :param sigma: Standard deviation
    :param dim: dimension(must be positive and also an odd number)
    :return: return the required Gaussian kernel.
    '''
    temp = [t - (dim//2) for t in range(dim)]
    assistant = []
    for i in range(dim):
        assistant.append(temp)
    # print(type(assistant))
    # print(assistant)
    assistant = np.array(assistant)
    # print(type(assistant))
    # print(assistant)
    temp = 2*sigma*sigma
    result = (1.0/(temp*np.pi))*np.exp(-(assistant**2+(assistant.T)**2)/temp)
    return result

# 返回高斯金字塔和高斯差分金字塔
def getDoG(img,n,sigma0,S = None,O = None):
    '''
    :param img: the original img.
    :param sigma0: sigma of the first stack of the first octave. default 1.52 for complicate reasons.
    :param n: how many stacks of feature that you wanna extract.
    :param S: how many stacks does every octave have. S must bigger than 3.
    :param k: the ratio of two adjacent stacks' scale.
    :param O: how many octaves do we have.
    :return: the DoG Pyramid
    '''
    # 确定高斯金字塔的组数O和每层的层数S
    if S == None:
        S = n + 3
    if O == None:
        O = int(np.log2(min(img.shape[0], img.shape[1]))) - 3

    k = 2 ** (1.0 / n)
    # 两维列表,第一维表示第几组,第二维表示第几层  直接将每一组的每一层的方差计算出来了
    sigma = [[(k**s)*sigma0*(1<<o) for s in range(S)] for o in range(O)]
    samplePyramid = [downsample(img, 1 << o) for o in range(O)]
    # 高斯金字塔的初始化,是列表的形式
    GuassianPyramid = []
    for i in range(O):  # 遍历每一组  每组的层数是相同的
        GuassianPyramid.append([])  # 高斯金字塔添加当前组的初始化列表
        for j in range(S):  # 遍历每一层
            dim = int(6*sigma[i][j] + 1)
            if dim % 2 == 0:
                dim += 1
            # 这里-1表示的是上面刚加入的当前组的初始化列表
            GuassianPyramid[-1].append(convolve(GuassianKernel(sigma[i][j], dim),samplePyramid[i],[dim//2,dim//2,dim//2,dim//2],[1,1]))
    DoG = [[GuassianPyramid[o][s+1] - GuassianPyramid[o][s] for s in range(S - 1)] for o in range(O)]


    return DoG,GuassianPyramid

def adjustLocalExtrema(DoG,o,s,x,y,contrastThreshold,edgeThreshold,sigma,n,SIFT_FIXPT_SCALE):
    SIFT_MAX_INTERP_STEPS = 5
    SIFT_IMG_BORDER = 5

    point = []

    img_scale = 1.0 / (255 * SIFT_FIXPT_SCALE)
    deriv_scale = img_scale * 0.5
    second_deriv_scale = img_scale
    cross_deriv_scale = img_scale * 0.25

    img = DoG[o][s]
    i = 0
    while i < SIFT_MAX_INTERP_STEPS:
        if s < 1 or s > n or y < SIFT_IMG_BORDER or y >= img.shape[1] - SIFT_IMG_BORDER or x < SIFT_IMG_BORDER or x >= img.shape[0] - SIFT_IMG_BORDER:
            return None,None,None,None

        img = DoG[o][s]
        prev = DoG[o][s - 1]
        next = DoG[o][s + 1]

        dD = [ (img[x,y + 1] - img[x, y - 1]) * deriv_scale,
               (img[x + 1, y] - img[x - 1, y]) * deriv_scale,
               (next[x, y] - prev[x, y]) * deriv_scale ]

        v2 = img[x, y] * 2
        dxx = (img[x, y + 1] + img[x, y - 1] - v2) * second_deriv_scale
        dyy = (img[x + 1, y] + img[x - 1, y] - v2) * second_deriv_scale
        dss = (next[x, y] + prev[x, y] - v2) * second_deriv_scale
        dxy = (img[x + 1, y + 1] - img[x + 1, y - 1] - img[x - 1, y + 1] + img[x - 1, y - 1]) * cross_deriv_scale
        dxs = (next[x, y + 1] - next[x, y - 1] - prev[x, y + 1] + prev[x, y - 1]) * cross_deriv_scale
        dys = (next[x + 1, y] - next[x - 1, y] - prev[x + 1, y] + prev[x - 1, y]) * cross_deriv_scale

        H=[ [dxx, dxy, dxs],
            [dxy, dyy, dys],
            [dxs, dys, dss]]

        X = np.matmul(np.linalg.pinv(np.array(H)),np.array(dD))

        xi = -X[2]
        xr = -X[1]
        xc = -X[0]

        if np.abs(xi) < 0.5 and np.abs(xr) < 0.5 and np.abs(xc) < 0.5:
            break

        y += int(np.round(xc))
        x += int(np.round(xr))
        s += int(np.round(xi))

        i+=1

    if i >= SIFT_MAX_INTERP_STEPS:
        return None,x,y,s
    if s < 1 or s > n or y < SIFT_IMG_BORDER or y >= img.shape[1] - SIFT_IMG_BORDER or x < SIFT_IMG_BORDER or x >= \
            img.shape[0] - SIFT_IMG_BORDER:
        return None, None, None, None


    t = (np.array(dD)).dot(np.array([xc, xr, xi]))

    contr = img[x,y] * img_scale + t * 0.5
    if np.abs( contr) * n < contrastThreshold:
        return None,x,y,s


    # 利用Hessian矩阵的迹和行列式计算主曲率的比值
    tr = dxx + dyy
    det = dxx * dyy - dxy * dxy
    if det <= 0 or tr * tr * edgeThreshold >= (edgeThreshold + 1) * (edgeThreshold + 1) * det:
        return None,x,y,s

    point.append((x + xr) * (1 << o))
    point.append((y + xc) * (1 << o))
    point.append(o + (s << 8) + (int(np.round((xi + 0.5)) * 255) << 16))
    point.append(sigma * np.power(2.0, (s + xi) / n)*(1 << o) * 2)

    return point,x,y,s

def GetMainDirection(img,r,c,radius,sigma,BinNum):
    expf_scale = -1.0 / (2.0 * sigma * sigma)

    X = []
    Y = []
    W = []
    temphist = []

    for i in range(BinNum):
        temphist.append(0.0)

    # 图像梯度直方图统计的像素范围
    k = 0
    for i in range(-radius,radius+1):
        y = r + i
        if y <= 0 or y >= img.shape[0] - 1:
            continue
        for j in range(-radius,radius+1):
            x = c + j
            if x <= 0 or x >= img.shape[1] - 1:
                continue

            dx = (img[y, x + 1] - img[y, x - 1])
            dy = (img[y - 1, x] - img[y + 1, x])

            X.append(dx)
            Y.append(dy)
            W.append((i * i + j * j) * expf_scale)
            k += 1


    length = k

    W = np.exp(np.array(W))
    Y = np.array(Y)
    X = np.array(X)
    Ori = np.arctan2(Y,X)*180/np.pi
    Mag = (X**2+Y**2)**0.5

    # 计算直方图的每个bin
    for k in range(length):
        bin = int(np.round((BinNum / 360.0) * Ori[k]))
        if bin >= BinNum:
            bin -= BinNum
        if bin < 0:
            bin += BinNum
        temphist[bin] += W[k] * Mag[k]

    # smooth the histogram
    # 高斯平滑
    temp = [temphist[BinNum - 1], temphist[BinNum - 2], temphist[0], temphist[1]]
    temphist.insert(0, temp[0])
    temphist.insert(0, temp[1])
    temphist.insert(len(temphist), temp[2])
    temphist.insert(len(temphist), temp[3])      # padding

    hist = []
    for i in range(BinNum):
        hist.append((temphist[i] + temphist[i+4]) * (1.0 / 16.0) + (temphist[i+1] + temphist[i+3]) * (4.0 / 16.0) + temphist[i+2] * (6.0 / 16.0))

    # 得到主方向
    maxval = max(hist)

    return maxval,hist

def LocateKeyPoint(DoG,sigma,GuassianPyramid,n,BinNum = 36,contrastThreshold = 0.04,edgeThreshold = 10.0):
    SIFT_ORI_SIG_FCTR = 1.52
    SIFT_ORI_RADIUS = 3 * SIFT_ORI_SIG_FCTR
    SIFT_ORI_PEAK_RATIO = 0.8

    SIFT_INT_DESCR_FCTR = 512.0
    # SIFT_FIXPT_SCALE = 48
    SIFT_FIXPT_SCALE = 1

    KeyPoints = []
    O = len(DoG)
    S = len(DoG[0])
    for o in range(O):
        for s in range(1,S-1):
            threshold = 0.5*contrastThreshold/(n*255*SIFT_FIXPT_SCALE)
            img_prev = DoG[o][s-1]
            img = DoG[o][s]
            img_next = DoG[o][s+1]
            for i in range(img.shape[0]):
                for j in range(img.shape[1]):
                    val = img[i,j]
                    eight_neiborhood_prev = img_prev[max(0, i - 1):min(i + 2, img_prev.shape[0]), max(0, j - 1):min(j + 2, img_prev.shape[1])]
                    eight_neiborhood = img[max(0, i - 1):min(i + 2, img.shape[0]), max(0, j - 1):min(j + 2, img.shape[1])]
                    eight_neiborhood_next = img_next[max(0, i - 1):min(i + 2, img_next.shape[0]), max(0, j - 1):min(j + 2, img_next.shape[1])]
                    if np.abs(val) > threshold and \
                        ((val > 0 and (val >= eight_neiborhood_prev).all() and (val >= eight_neiborhood).all() and (val >= eight_neiborhood_next).all())
                         or (val < 0 and (val <= eight_neiborhood_prev).all() and (val <= eight_neiborhood).all() and (val <= eight_neiborhood_next).all())):
                        #精调关键点位置
                        point,x,y,layer = adjustLocalExtrema(DoG,o,s,i,j,contrastThreshold,edgeThreshold,sigma,n,SIFT_FIXPT_SCALE)
                        if point == None:
                            continue

                        scl_octv = point[-1]*0.5/(1 << o)
                        #确定主方向
                        omax,hist = GetMainDirection(GuassianPyramid[o][layer],x,y,int(np.round(SIFT_ORI_RADIUS * scl_octv)),SIFT_ORI_SIG_FCTR * scl_octv,BinNum)
                        mag_thr = omax * SIFT_ORI_PEAK_RATIO
                        for k in range(BinNum):
                            if k > 0:
                                l = k - 1
                            else:
                                l = BinNum - 1
                            if k < BinNum - 1:
                                r2 = k + 1
                            else:
                                r2 = 0
                            if hist[k] > hist[l] and hist[k] > hist[r2] and hist[k] >= mag_thr:
                                bin = k + 0.5 * (hist[l]-hist[r2]) /(hist[l] - 2 * hist[k] + hist[r2])
                                if bin < 0:
                                    bin = BinNum + bin
                                else:
                                    if bin >= BinNum:
                                        bin = bin - BinNum
                                temp = point[:]
                                temp.append((360.0/BinNum) * bin)
                                KeyPoints.append(temp)


    return KeyPoints


def calcSIFTDescriptor(img,ptf,ori,scl,d,n,SIFT_DESCR_SCL_FCTR = 3.0,SIFT_DESCR_MAG_THR = 0.2,SIFT_INT_DESCR_FCTR = 512.0,FLT_EPSILON = 1.19209290E-07):
    dst = []
    pt = [int(np.round(ptf[0])), int(np.round(ptf[1]))] # 坐标点取整
    cos_t = np.cos(ori * (np.pi / 180)) # 余弦值
    sin_t = np.sin(ori * (np.pi / 180)) # 正弦值
    bins_per_rad = n / 360.0
    exp_scale = -1.0 / (d * d * 0.5)
    hist_width = SIFT_DESCR_SCL_FCTR * scl
    radius = int(np.round(hist_width * 1.4142135623730951 * (d + 1) * 0.5))
    cos_t /= hist_width
    sin_t /= hist_width

    rows = img.shape[0]
    cols = img.shape[1]


    hist = [0.0]*((d+2)*(d+2)*(n+2))
    X = []
    Y = []
    RBin = []
    CBin = []
    W = []

    k = 0
    for i in range(-radius,radius+1):
        for j in range(-radius,radius+1):

            c_rot = j * cos_t - i * sin_t
            r_rot = j * sin_t + i * cos_t
            rbin = r_rot + d // 2 - 0.5
            cbin = c_rot + d // 2 - 0.5
            r = pt[1] + i
            c = pt[0] + j

            if rbin > -1 and rbin < d and cbin > -1 and cbin < d and r > 0 and r < rows - 1 and c > 0 and c < cols - 1:
                dx = (img[r, c+1] - img[r, c-1])
                dy = (img[r-1, c] - img[r+1, c])
                X.append(dx)
                Y.append(dy)
                RBin.append(rbin)
                CBin.append(cbin)
                W.append((c_rot * c_rot + r_rot * r_rot) * exp_scale)
                k+=1

    length = k
    Y = np.array(Y)
    X = np.array(X)
    Ori = np.arctan2(Y,X)*180/np.pi
    Mag = (X ** 2 + Y ** 2) ** 0.5
    W = np.exp(np.array(W))

    for k in range(length):
        rbin = RBin[k]
        cbin = CBin[k]
        obin = (Ori[k] - ori) * bins_per_rad
        mag = Mag[k] * W[k]

        r0 = int(rbin)
        c0 = int(cbin)
        o0 = int(obin)
        rbin -= r0
        cbin -= c0
        obin -= o0

        if o0 < 0:
            o0 += n
        if o0 >= n:
            o0 -= n

        # histogram update using tri-linear interpolation
        v_r1 = mag * rbin
        v_r0 = mag - v_r1

        v_rc11 = v_r1 * cbin
        v_rc10 = v_r1 - v_rc11

        v_rc01 = v_r0 * cbin
        v_rc00 = v_r0 - v_rc01

        v_rco111 = v_rc11 * obin
        v_rco110 = v_rc11 - v_rco111

        v_rco101 = v_rc10 * obin
        v_rco100 = v_rc10 - v_rco101

        v_rco011 = v_rc01 * obin
        v_rco010 = v_rc01 - v_rco011

        v_rco001 = v_rc00 * obin
        v_rco000 = v_rc00 - v_rco001

        idx = ((r0 + 1) * (d + 2) + c0 + 1) * (n + 2) + o0
        hist[idx] +=  v_rco000
        hist[idx+1] += v_rco001
        hist[idx + (n+2)] += v_rco010
        hist[idx + (n+3)] += v_rco011
        hist[idx+(d+2) * (n+2)] += v_rco100
        hist[idx+(d+2) * (n+2)+1] += v_rco101
        hist[idx+(d+3) * (n+2)] += v_rco110
        hist[idx+(d+3) * (n+2)+1] += v_rco111

    # finalize histogram, since the orientation histograms are circular
    for i in range(d):
        for j in range(d):
            idx = ((i+1) * (d+2) + (j+1)) * (n+2)
            hist[idx] += hist[idx+n]
            hist[idx+1] += hist[idx+n+1]
            for k in range(n):
                dst.append(hist[idx+k])

    # copy histogram to the descriptor,
    # apply hysteresis thresholding
    # and scale the result, so that it can be easily converted
    # to byte array
    nrm2 = 0
    length = d * d * n
    for k in range(length):
        nrm2 += dst[k] * dst[k]
    thr = np.sqrt(nrm2) * SIFT_DESCR_MAG_THR

    nrm2 = 0
    for i in range(length):
        val = min(dst[i], thr)
        dst[i] = val
        nrm2 += val * val
    nrm2 = SIFT_INT_DESCR_FCTR / max(np.sqrt(nrm2), FLT_EPSILON)
    for k in range(length):
        dst[k] = min(max(dst[k] * nrm2,0),255)

    return dst


def calcDescriptors(gpyr,keypoints,SIFT_DESCR_WIDTH = 4,SIFT_DESCR_HIST_BINS = 8):
    # SIFT_DESCR_WIDTH = 4,描述直方图的宽度
    # SIFT_DESCR_HIST_BINS = 8
    d = SIFT_DESCR_WIDTH
    n = SIFT_DESCR_HIST_BINS
    descriptors = []

    for i in range(len(keypoints)):
        kpt = keypoints[i]
        o = kpt[2] & 255
        s = (kpt[2] >> 8) & 255 # 该特征点所在的组序号和层序号
        scale = 1.0 / (1 << o)  # 缩放倍数
        size = kpt[3] * scale # 该特征点所在组的图像尺寸
        ptf = [kpt[1] * scale, kpt[0] * scale] # 该特征点在金字塔组中的坐标
        img = gpyr[o][s] # 该点所在的金字塔图像

        descriptors.append(calcSIFTDescriptor(img, ptf, kpt[-1], size * 0.5, d, n))
    return descriptors

def SIFT(img,showDoGimgs = False):  # he
    SIFT_SIGMA = 1.6  # 想要得到的尺度
    SIFT_INIT_SIGMA = 0.5 # 假设的摄像头的尺度
    sigma0 = np.sqrt(SIFT_SIGMA**2-SIFT_INIT_SIGMA**2)

    n = 3
    # 得到高斯差分金字塔
    DoG,GuassianPyramid = getDoG(img, n, sigma0)  # he

    #展示高斯差分金字塔
    if showDoGimgs:
        for i in DoG:
            print(i)
            for j in i:
                plt.imshow(j.astype(np.uint8), cmap='gray')
                plt.axis('off')
                # plt.show()

    # 关键点定位
    KeyPoints = LocateKeyPoint(DoG, SIFT_SIGMA, GuassianPyramid, n)  # he
    # 计算描述符
    discriptors = calcDescriptors(GuassianPyramid,KeyPoints)  # he

    return KeyPoints,discriptors


def Lines(img,info,color = (255,0,0),err = 700):

    if len(img.shape) == 2:
        result = np.dstack((img,img,img))
    else:
        result = img
    k = 0
    for i in range(result.shape[0]):
        for j in range(result.shape[1]):
            temp = (info[:,1]-info[:,0])
            A = (j - info[:,0])*(info[:,3]-info[:,2])
            B = (i - info[:,2])*(info[:,1]-info[:,0])
            temp[temp == 0] = 1e-9
            t = (j-info[:,0])/temp
            e = np.abs(A-B)
            temp = e < err
            if (temp*(t >= 0)*(t <= 1)).any():
                result[i,j] = color
                k+=1
    print(k)

    return result

def drawLines(X1,X2,Y1,Y2,dis,img,num = 10):

    info = list(np.dstack((X1,X2,Y1,Y2,dis))[0])
    info = sorted(info,key=lambda x:x[-1])
    info = np.array(info)
    info = info[:min(num,info.shape[0]),:]
    img = Lines(img,info)
    #plt.imsave('./sift/3.jpg', img)

    if len(img.shape) == 2:
        plt.imshow(img.astype(np.uint8),cmap='gray')
    else:
        plt.imshow(img.astype(np.uint8))
    plt.axis('off')
    #plt.plot([info[:,0], info[:,1]], [info[:,2], info[:,3]], 'c')
    # fig = plt.gcf()
    # fig.set_size_inches(int(img.shape[0]/100.0),int(img.shape[1]/100.0))
    #plt.savefig('./sift/2.jpg')
    plt.show()


if __name__ == '__main__':
    print("********start**********")
    print("read the first image")
    origimg = plt.imread('./SIFTimg/1.jpeg')
    if len(origimg.shape) ==  3:
        img = origimg.mean(axis=-1)
    else:
        img = origimg
    # 计算图片的关键点和描述符
    keyPoints,discriptors = SIFT(img)

    print("read the second image")
    origimg2 = plt.imread('./SIFTimg/2.jpeg')
    if len(origimg.shape) == 3:
        img2 = origimg2.mean(axis=-1)
    else:
        img2 = origimg2
    ScaleRatio = img.shape[0]*1.0/img2.shape[0]  #第一张图片和第二张图片的比例大小
    print(img.shape,img2.shape,ScaleRatio)

    img2 = np.array(Image.fromarray(img2).resize((int(round(ScaleRatio * img2.shape[1])),img.shape[0]), Image.BICUBIC))
    print(img2.shape)


    keyPoints2, discriptors2 = SIFT(img2,True)

    # 使用knn算法进行匹配,然后将匹配结果放入画线函数
    print("start knn")
    knn = KNeighborsClassifier(n_neighbors=1)
    print("type"+str(type(knn)))
    print("content"+str(knn))
    print(knn)

    knn.fit(discriptors,[0]*len(discriptors))
    match = knn.kneighbors(discriptors2,n_neighbors=1,return_distance=True)
    # print("match")
    # print(match)
    keyPoints = np.array(keyPoints)[:,:2]
    keyPoints2 = np.array(keyPoints2)[:,:2]

    keyPoints2[:, 1] = img.shape[1] + keyPoints2[:, 1]

    origimg2 = np.array(Image.fromarray(origimg2).resize((img2.shape[1],img2.shape[0]), Image.BICUBIC))
    result = np.hstack((origimg,origimg2))


    keyPoints = keyPoints[match[1][:,0]]

    X1 = keyPoints[:, 1]
    X2 = keyPoints2[:, 1]
    Y1 = keyPoints[:, 0]
    Y2 = keyPoints2[:, 0]
    drawLines(X1,X2,Y1,Y2,match[0][:,0],result,6)
最后再次感谢 会飞的吴克,给出完整可运行代码
代码链接
作者:孙建钊
出处:http://www.cnblogs.com/sunjianzhao/
本文版权归作者和博客园共有,欢迎转载,但未经作者同意必须保留此段声明,且在文章页面明显位置给出原文连接,否则保留追究法律责任的权利。


【推荐】国内首个AI IDE,深度理解中文开发场景,立即下载体验Trae
【推荐】编程新体验,更懂你的AI,立即体验豆包MarsCode编程助手
【推荐】抖音旗下AI助手豆包,你的智能百科全书,全免费不限次数
【推荐】轻量又高性能的 SSH 工具 IShell:AI 加持,快人一步
· 25岁的心里话
· 闲置电脑爆改个人服务器(超详细) #公网映射 #Vmware虚拟网络编辑器
· 零经验选手,Compose 一天开发一款小游戏!
· 因为Apifox不支持离线,我果断选择了Apipost!
· 通过 API 将Deepseek响应流式内容输出到前端