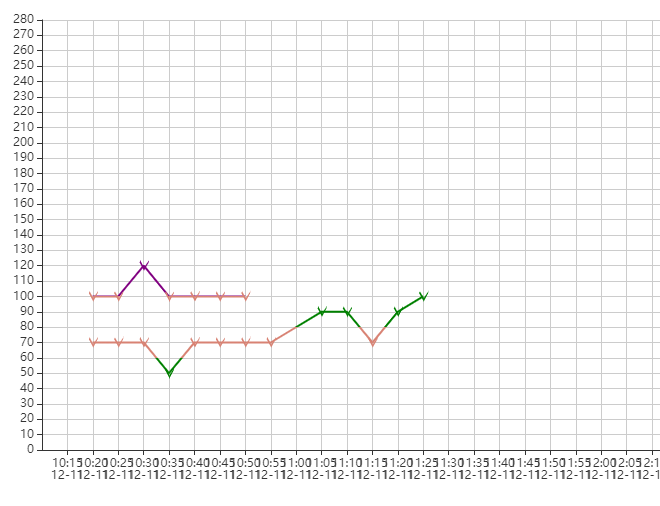
echarts折线图超出范围显示不同颜色(多条折线)
<!DOCTYPE html>
<html lang="en">
<head>
<meta charset="UTF-8">
<meta name="viewport" content="width=device-width, initial-scale=1.0">
<meta http-equiv="X-UA-Compatible" content="ie=edge">
<title>echarts</title>
<script src="https://cdn.bootcss.com/jquery/3.4.1/jquery.js"></script>
<script src="https://cdn.bootcss.com/echarts/4.2.1-rc1/echarts.min.js"></script>
<style>
</style>
</head>
<body>
<div id="box">
<div id="main" style="width: 100%;height:500px;"></div>
</div>
<script>
var myChart = echarts.init(document.getElementById('main'));
var options = {
grid: {
left: 50,
top: 20,
bottom: 50,
right: 50,
show: false,
},
tooltip: {
trigger: 'axis',
axisPointer: {
type: 'shadow',
},
},
xAxis: {
type: 'time',
show: true,
splitNumber: 48,
},
yAxis: [
{
min: 0,
max: 280,
type: 'value',
show: true,
splitNumber: 22,
position: 'left',
},
{
min: 14,
max: 42,
type: 'value',
show: true,
position: 'right',
},
],
visualMap: [{
show: false,
dimension: 1,
seriesIndex:0,//第一部分数据
pieces: [{ min: 60, max: 100 }],
outOfRange: {
color:'purple',
},
},
{
show: false,
dimension: 1,
seriesIndex:1,//第一部分数据
pieces: [{ min: 60, max: 80 }],
outOfRange: {
color:'green',
},
}],
series: [{
id: "ART",
name: "有创收缩压",
smooth: false,
symbol: "path://:M25.696 190.164v-0.082h-0.089l0.089 0.082zM920.081 257.951v-67.87h-87.874l-322.642 298.143-322.634-298.143h-86.711v68.958l409.346 378.243 410.514-379.331z",
symbolSize: "10",
type: "line",
data:[
["2020-12-11 10:10:00", ""],
["2020-12-11 10:20:00", "100"],
["2020-12-11 10:25:00", "100"],
["2020-12-11 10:30:00", "120"],
["2020-12-11 10:35:00", "100"],
["2020-12-11 10:40:00", "100"],
["2020-12-11 10:45:00", "100"],
["2020-12-11 10:50:00", "100"],
["2020-12-11 14:10:00", ""],
]
},{
id: "ARTs",
name: "有创收缩压",
smooth: false,
symbol: "path://:M25.696 190.164v-0.082h-0.089l0.089 0.082zM920.081 257.951v-67.87h-87.874l-322.642 298.143-322.634-298.143h-86.711v68.958l409.346 378.243 410.514-379.331z",
symbolSize: "10",
type: "line",
data:[
["2020-12-11 10:10:00", ""],
["2020-12-11 10:20:00", "70"],
["2020-12-11 10:25:00", "70"],
["2020-12-11 10:30:00", "70"],
["2020-12-11 10:35:00", "50"],
["2020-12-11 10:40:00", "70"],
["2020-12-11 10:45:00", "70"],
["2020-12-11 10:50:00", "70"],
["2020-12-11 10:55:00", "70"],
["2020-12-11 11:05:00", "90"],
["2020-12-11 11:10:00", "90"],
["2020-12-11 11:15:00", "70"],
["2020-12-11 11:20:00", "90"],
["2020-12-11 11:25:00", "100"],
["2020-12-11 14:10:00", ""],
]
}],
}
myChart.setOption(options)
</script>
</body>
</html>