

seaborn 第二章:不同形式的散点图
目录
二、散点图
import seaborn as sns import matplotlib.pyplot as plt sns.set_theme(style = 'whitegrid') # 加载 diamonds 数据集 diamonds = sns.load_dataset('diamonds') diamonds.head()
| carat | cut | color | clarity | depth | table | price | x | y | z | |
|---|---|---|---|---|---|---|---|---|---|---|
| 0 | 0.23 | Ideal | E | SI2 | 61.5 | 55.0 | 326 | 3.95 | 3.98 | 2.43 |
| 1 | 0.21 | Premium | E | SI1 | 59.8 | 61.0 | 326 | 3.89 | 3.84 | 2.31 |
| 2 | 0.23 | Good | E | VS1 | 56.9 | 65.0 | 327 | 4.05 | 4.07 | 2.31 |
| 3 | 0.29 | Premium | I | VS2 | 62.4 | 58.0 | 334 | 4.20 | 4.23 | 2.63 |
| 4 | 0.31 | Good | J | SI2 | 63.3 | 58.0 | 335 | 4.34 | 4.35 | 2.75 |
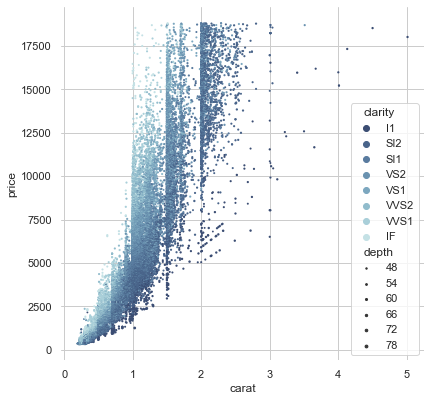
# 画出 点的大小 和 颜色 不同的高维散点图 f, ax = plt.subplots(figsize = (6.5, 6.5)) sns.despine(f, left = True, bottom = True) clarity_ranking = ['I1', 'SI2', 'SI1', 'VS2', 'VS1', 'VVS2', 'VVS1', 'IF'] sns.scatterplot( x = 'carat', y = 'price', hue = 'clarity', size = 'depth', palette = 'ch:r=-.2,d=.3_r', hue_order = clarity_ranking, sizes = (1, 8), linewidth = 0, data = diamonds, ax = ax ) # hue: 色调,size: 大小
sns.scatterplot() 其他案例
来自:https://seaborn.pydata.org/generated/seaborn.scatterplot.html#seaborn.scatterplot
注:seaborn 数据集下载地址 https://github.com/mwaskom/seaborn-data
## 导入数据集 import pandas as pd tips = pd.read_csv("../../seaborn-data-master/tips.csv") tips.head()
| total_bill | tip | sex | smoker | day | time | size | |
|---|---|---|---|---|---|---|---|
| 0 | 16.99 | 1.01 | Female | No | Sun | Dinner | 2 |
| 1 | 10.34 | 1.66 | Male | No | Sun | Dinner | 3 |
| 2 | 21.01 | 3.50 | Male | No | Sun | Dinner | 3 |
| 3 | 23.68 | 3.31 | Male | No | Sun | Dinner | 2 |
| 4 | 24.59 | 3.61 | Female | No | Sun | Dinner | 4 |
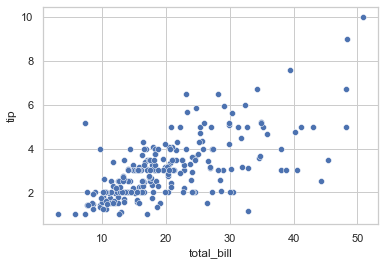
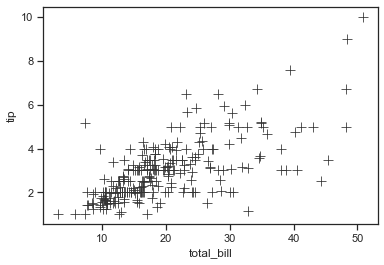
example 1
## 以 total_bill 为 x 轴,tip 为 y 轴,绘制散点图 sns.scatterplot(data = tips, x = 'total_bill', y = 'tip')
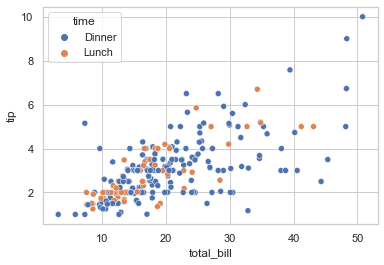
example 2
## 以 total_bill 为 x 轴,tip 为 y 轴,time 为分类因子,画出不同 time 类的散点图(用不同颜色区分) sns.scatterplot(data = tips, x = 'total_bill', y = 'tip', hue = 'time')
example 3
## 在 example 的基础上,增加散点形状区分的条件 sns.scatterplot(data = tips, x = 'total_bill', y = 'tip', hue = 'time', style = 'time')
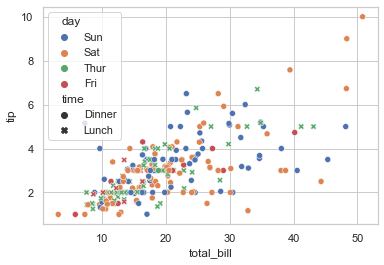
example 4
## 散点的形状和颜色的分类依据可以不同 sns.scatterplot(data = tips, x = 'total_bill', y = 'tip', hue = 'day', style = 'time')
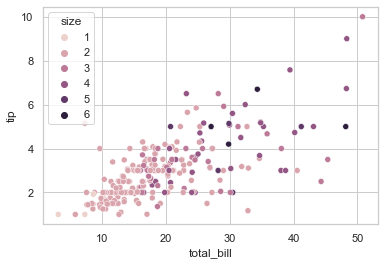
example 5
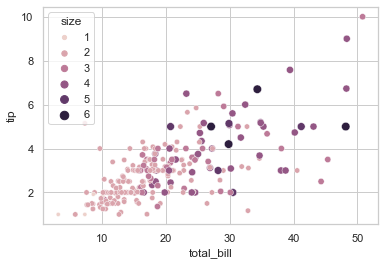
# 若分配给色版的变量是数字,会使用不同的默认调色板 sns.scatterplot(data = tips, x = 'total_bill', y = 'tip', hue = 'size')
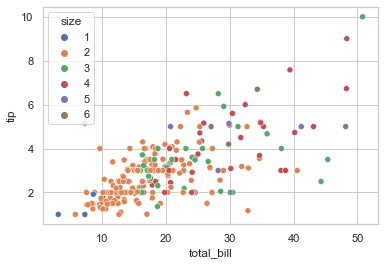
example 6
## 可以使用 palette 更改色调 sns.scatterplot(data = tips, x = 'total_bill', y = 'tip', hue = 'size', palette = 'deep')
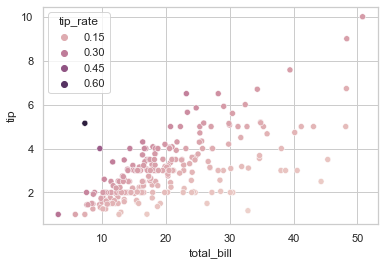
example 7
## 如果有大量的唯一数值,图例将显示一个具有代表性的等间距集合 tip_rate = tips.eval('tip / total_bill').rename('tip_rate') sns.scatterplot(data = tips, x = 'total_bill', y = 'tip', hue = tip_rate)
example 8
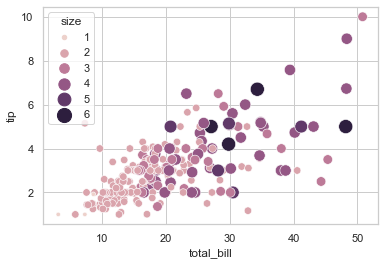
## 在 example 5 的基础上还能增加点的大小 sns.scatterplot(data = tips, x = 'total_bill', y = 'tip', hue = 'size', size = 'size')
example 9
## 可以更改散点的大小 sns.scatterplot( data = tips, x = 'total_bill', y = 'tip', hue = 'size', size = 'size', sizes = (20, 200), legend = 'full' )
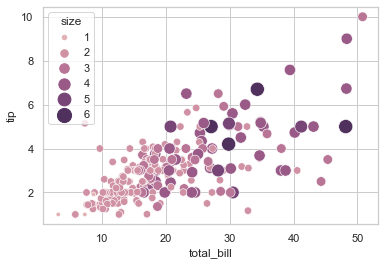
example 10
## 传入一个元组或matplotlib.colors.Normalize以控制色调 sns.scatterplot( data = tips, x = 'total_bill', y = 'tip', hue = 'size', size = 'size', sizes = (20, 200), hue_norm = (0,7), legend = 'full' )
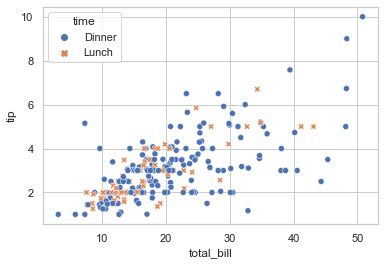
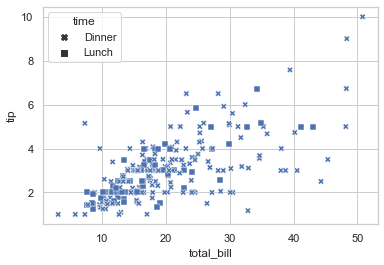
example 11
## 传入一个字典控制散点形状 markers = {'Lunch' : 's', 'Dinner' : 'X'} sns.scatterplot(data = tips, x = 'total_bill', y = 'tip', style = 'time', markers = markers)
example 12
sns.scatterplot(data = tips, x = 'total_bill', y = 'tip', s = 100, color = '.2', marker = "+")
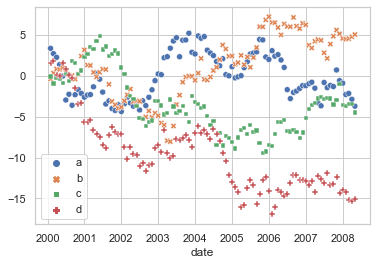
example 13
## 可以绘制不同 类型 数据 的 时间序列图像 import numpy as np import pandas as pd index = pd.date_range("1 1 2000", periods=100, freq='m', name='date') data = np.random.randn(100, 4).cumsum(axis=0) wide_df = pd.DataFrame(data, index, ['a','b','c','d']) sns.scatterplot(data=wide_df)
wide_df.head()
| a | b | c | d | |
|---|---|---|---|---|
| date | ||||
| 2000-01-31 | 3.381766 | -0.360579 | -0.080106 | 1.578611 |
| 2000-02-29 | 2.724598 | 0.351141 | -0.914548 | 1.825725 |
| 2000-03-31 | 2.276614 | 0.855341 | -0.227480 | 0.075641 |
| 2000-04-30 | 1.385905 | 0.793799 | -0.392478 | -0.053513 |
| 2000-05-31 | -0.011497 | 0.985883 | -0.829674 | 1.539929 |
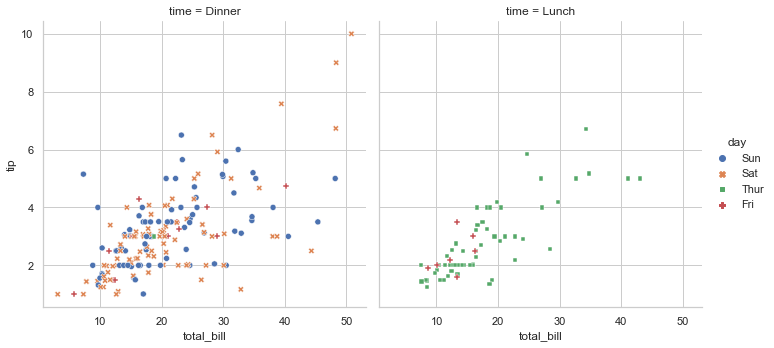
example 14
## 按类别拆分数据,画到不同的子图上 sns.relplot( data = tips, x = 'total_bill', y = 'tip', col = 'time', hue = 'day', style = 'day', kind = 'scatter' )


【推荐】国内首个AI IDE,深度理解中文开发场景,立即下载体验Trae
【推荐】编程新体验,更懂你的AI,立即体验豆包MarsCode编程助手
【推荐】抖音旗下AI助手豆包,你的智能百科全书,全免费不限次数
【推荐】轻量又高性能的 SSH 工具 IShell:AI 加持,快人一步
· 阿里最新开源QwQ-32B,效果媲美deepseek-r1满血版,部署成本又又又降低了!
· 开源Multi-agent AI智能体框架aevatar.ai,欢迎大家贡献代码
· Manus重磅发布:全球首款通用AI代理技术深度解析与实战指南
· 被坑几百块钱后,我竟然真的恢复了删除的微信聊天记录!
· 没有Manus邀请码?试试免邀请码的MGX或者开源的OpenManus吧