windows监控主机资源使用情况工具 - Prometheus + windows_exporter + grafana
2022-06-14 11:54 起个昵称 阅读(1097) 评论(0) 收藏 举报下载
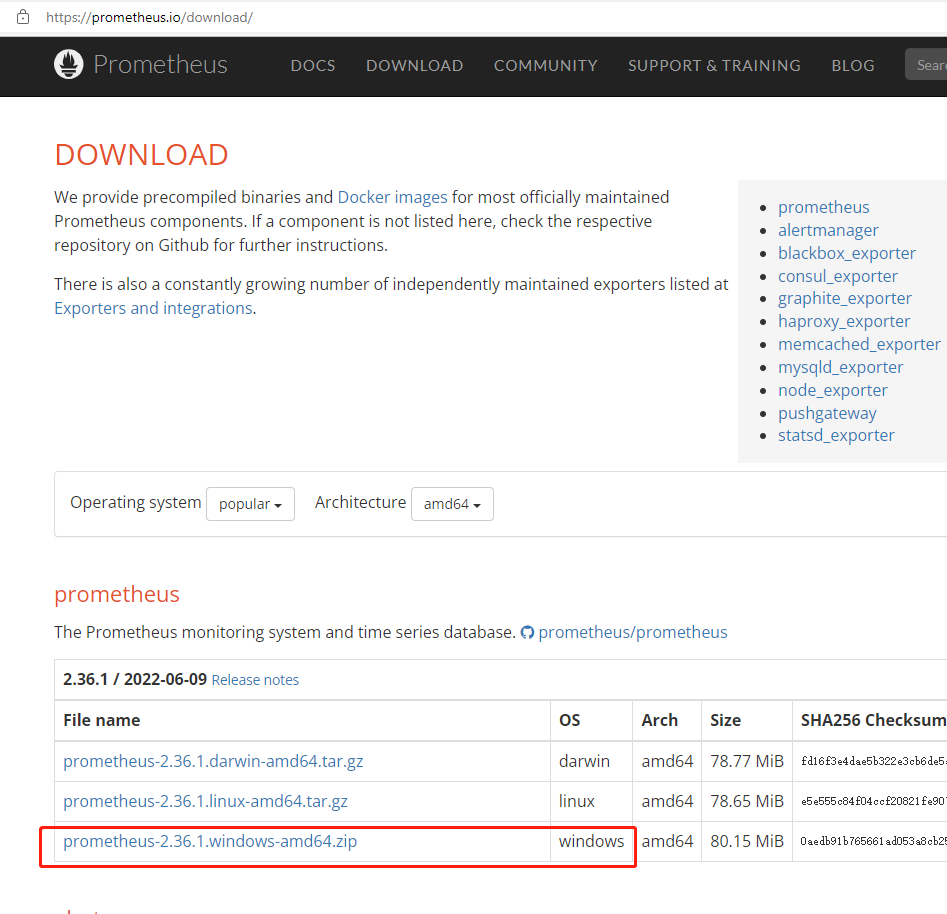
Prometheus:
https://prometheus.io/download/
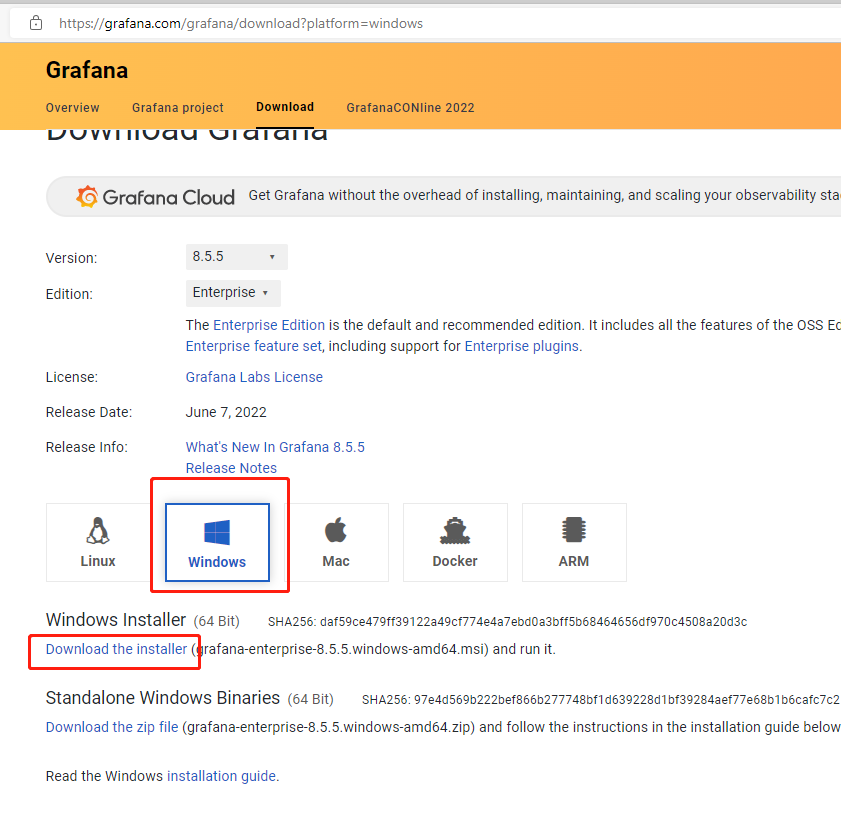
grafana:
https://grafana.com/grafana/download?platform=windows
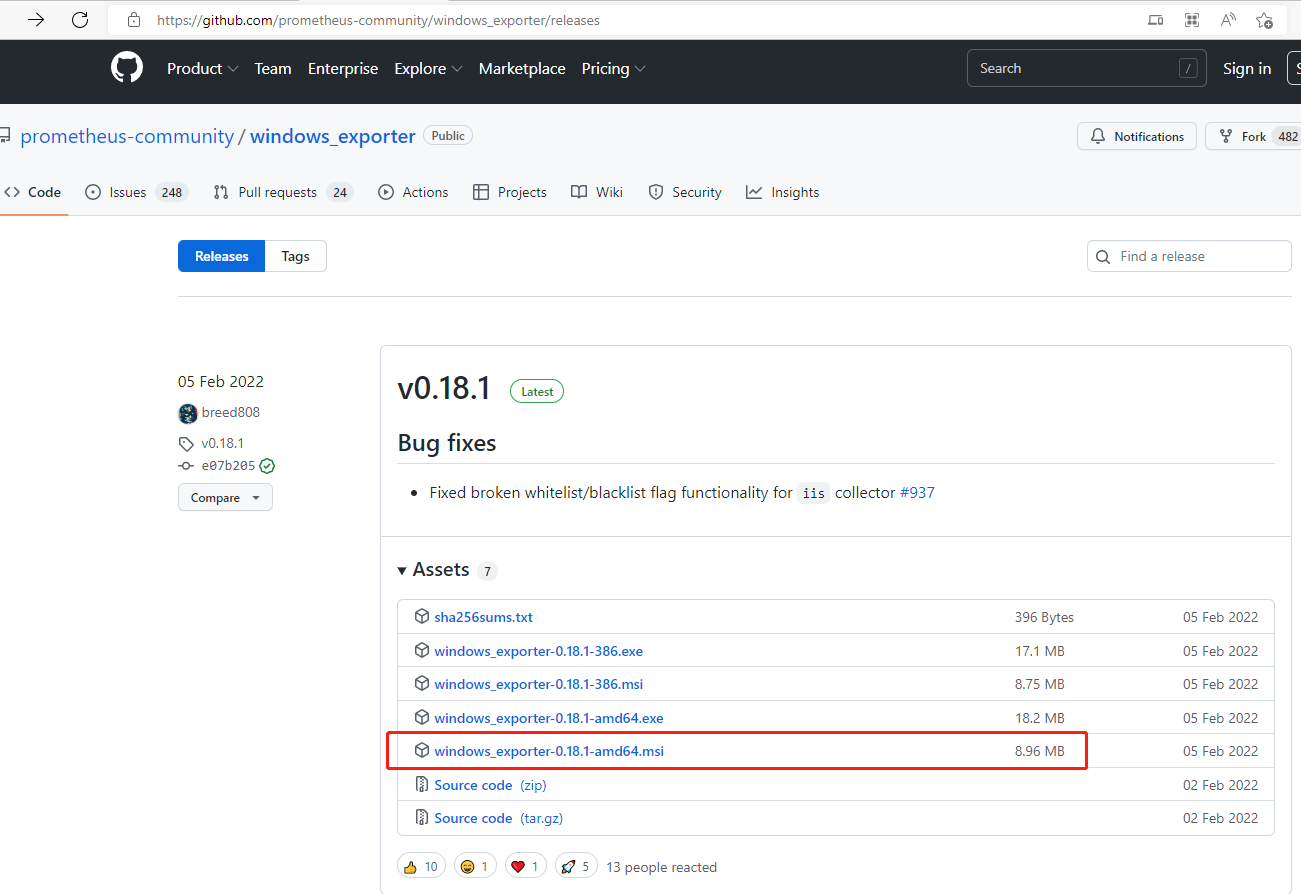
windows_exporter:
https://github.com/prometheus-community/windows_exporter/releases
安装及启动
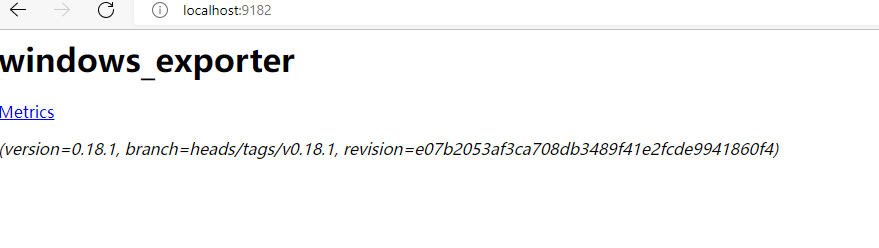
windows_exporter不需要安装, 直接右键,用管理员身份运行,或者双击运行即可。启动后在浏览器输入localhost:9182查看是否能访问
Prometheus解压,然后找到prometheus.yml这个文件,把windows_exporter的ip和端口加进去,如下代码,注意缩进。不然会导致启动Prometheus失败
- job_name: "windows_exporter"
static_configs:
- targets: ["localhost:9182"]
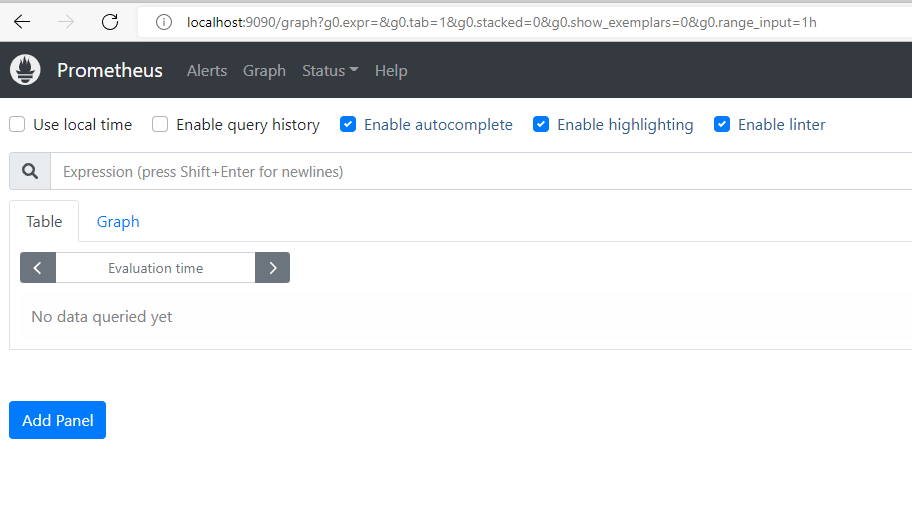
添加好后保存,然后找到prometheus.exe,右键,选择以管理员身份运行,即为启动。启动后,在浏览器输入localhost:9090查看是否能访问
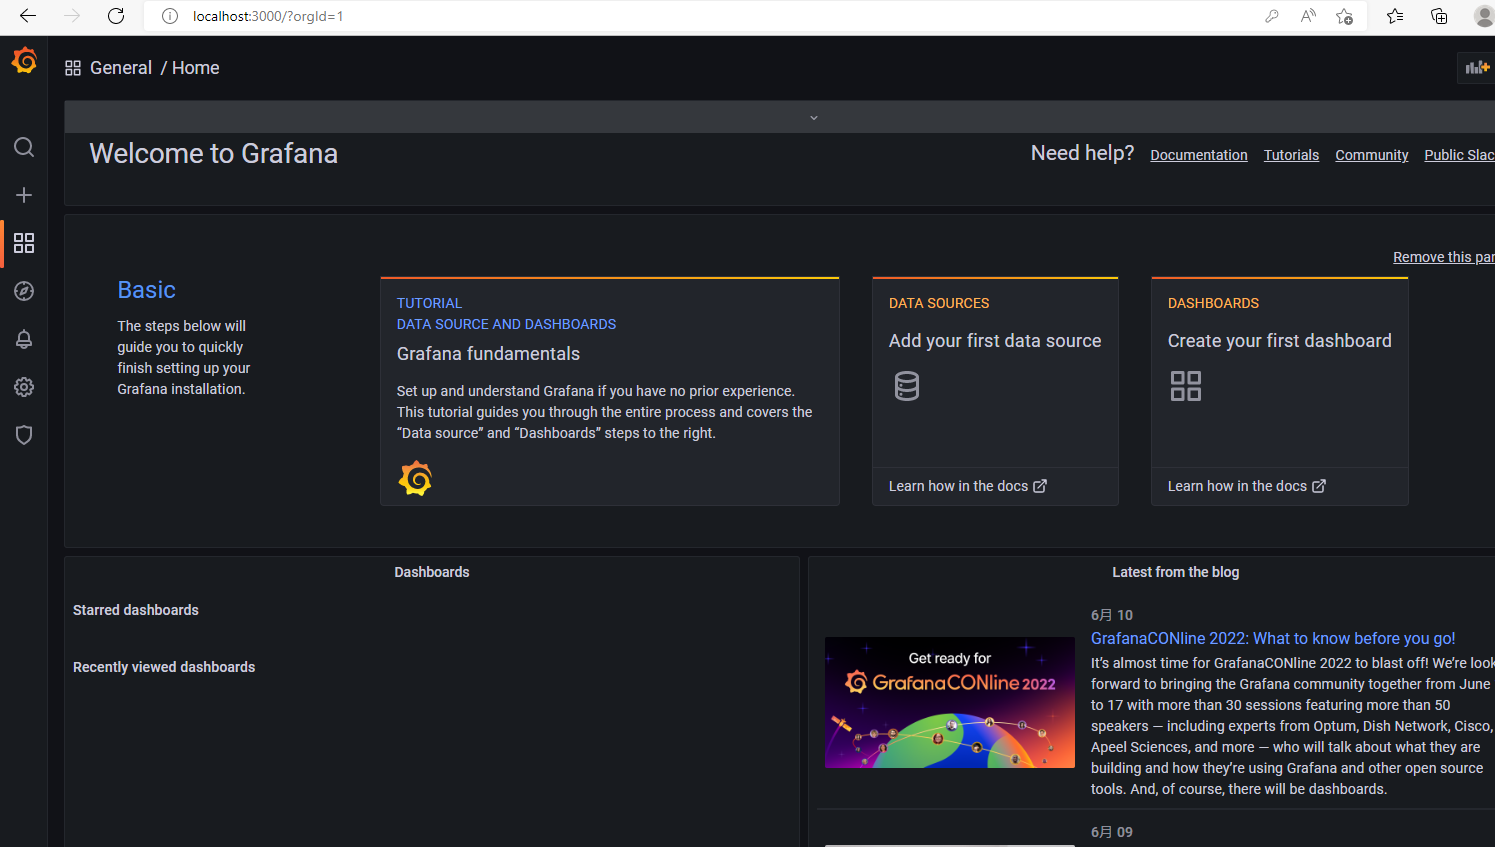
grafana双击进行安装,选择安装路径,其他默认,安装好后在\grafana\bin路径找到grafana-server.exem,右键,选择以管理员身份运行,即为启动。启动后,在浏览器输入localhost:3000查看是否能访问。初始用户名密码为admin/admin

三者的关系
windows_exporter 收集电脑资源使用数据
prometheus 抓取windows_exporter收集到的数据
grafana 数据展示
配置grafana
三个服务都启动后,在浏览器输入localhost:3000,打开grafana,首次登陆默认用户名和密码都是admin,登陆后会提示修改密码,进行密码修改,就成功登陆到grafana的home page了
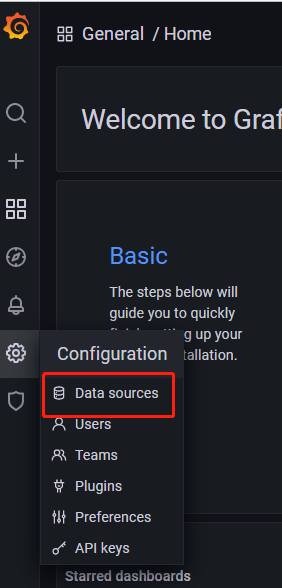
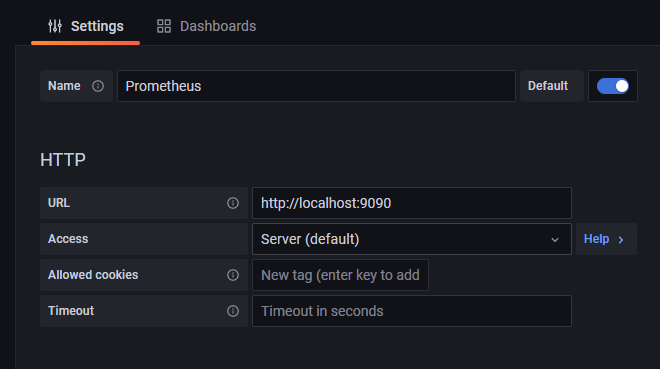
登陆后,配置数据源 data sources。选择Prometheus,只填了URL,其他我都保持默认了。点击最下面的Save&test,出现绿色√即为成功
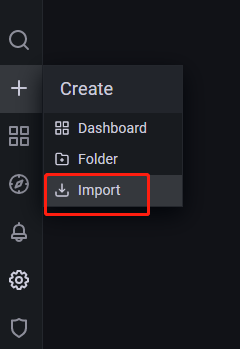
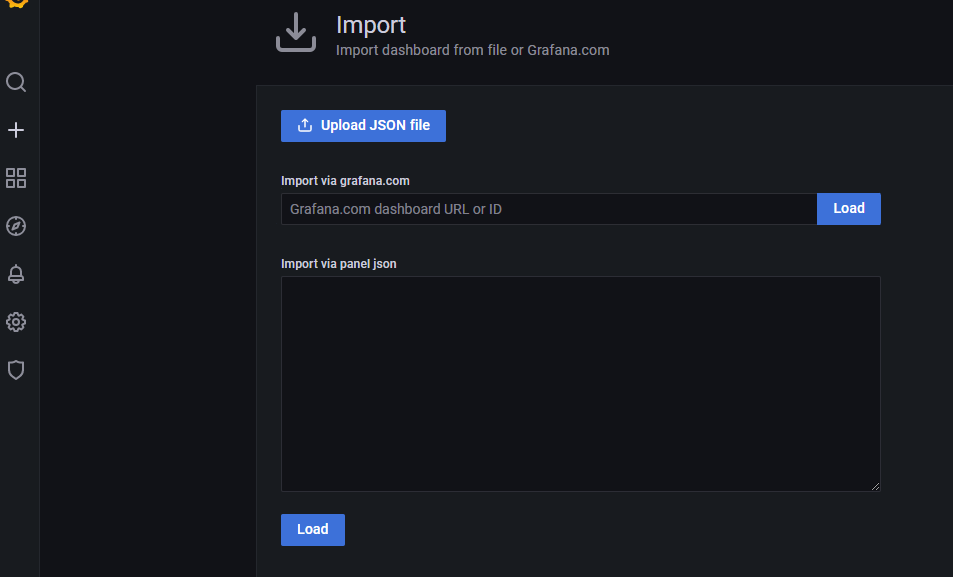
配置好data sources,就是搭建dashboard了,可用自定义dashboard,也可以用别人的模板,我用别人的模板。我用了10467模板id
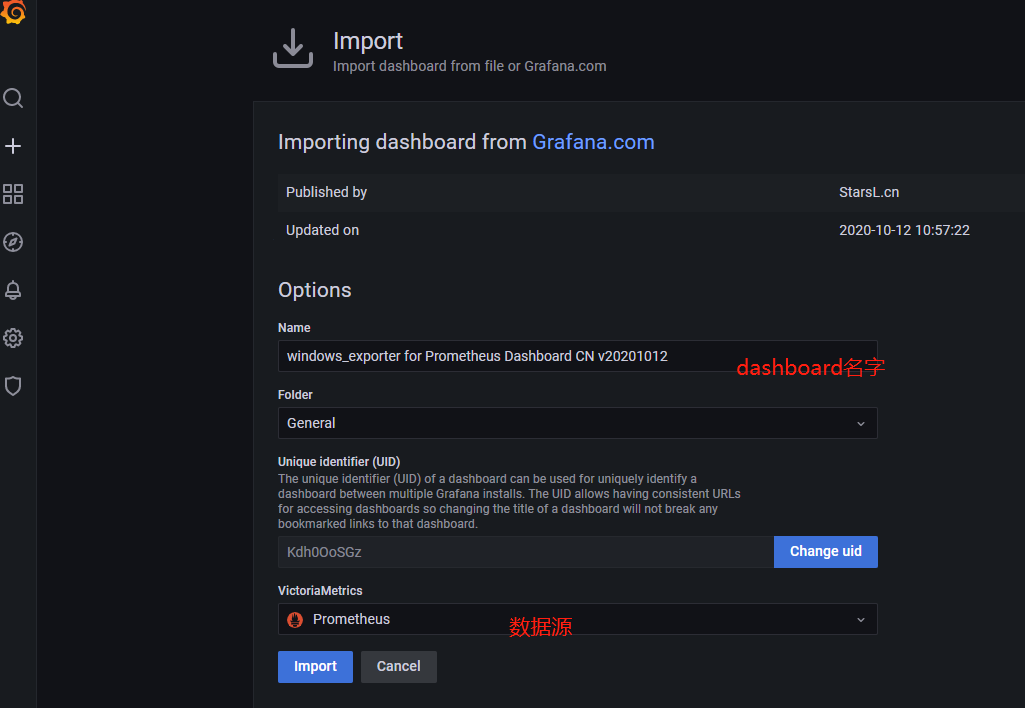
import后dashboard显示

一个dashboard监控多个主机性能
在prometheus.yml配置文件添加主机地址
路径:prometheus-2.36.1.windows-amd64\prometheus.yml
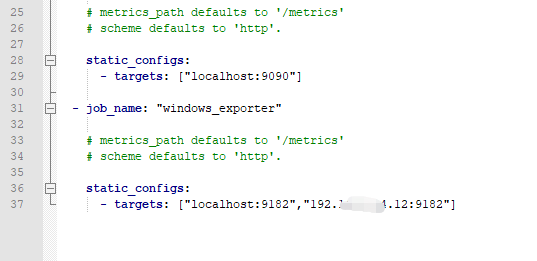
有多少个主机,就在windows_exporter的job的targets上加多少,以逗号隔开
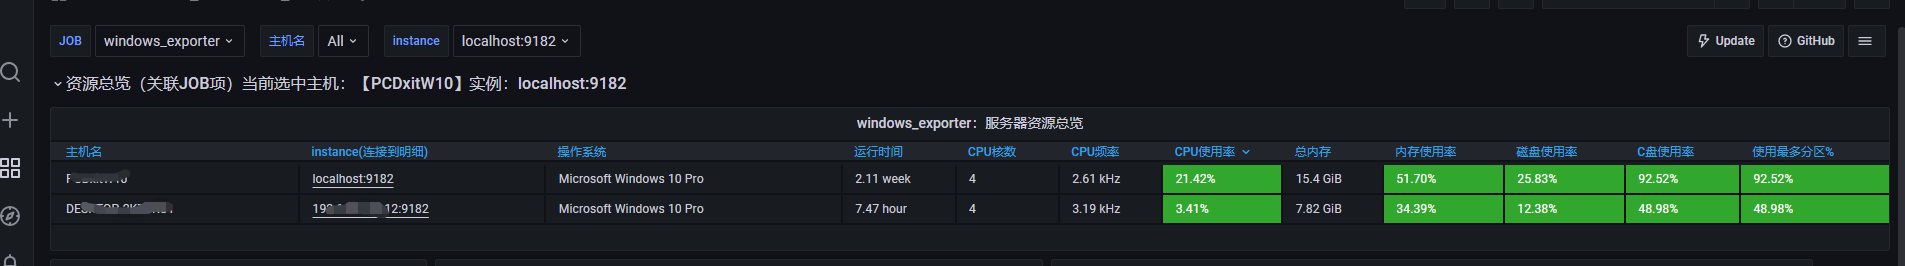
Grafana界面显示效果如下

 浙公网安备 33010602011771号