使用 Sleuth 和 Zipkin 实现分布式链路追踪
Spring Cloud 微服务之间的调用关系,通常随着业务的不断扩张而变得越来越复杂。如果调用链路上任何一个服务出现问题或者网络超时,导致通过日志快速排查和定位问题非常困难。分布式链路追踪就可以轻松解决该场景所面临的问题,其中一种比较简单的方案是采用 Spring Cloud Sleuth
Spring Cloud Sleuth 是 Spring Cloud 体系中的一个模块,用于在整个分布式系统中跟踪一个用户请求的过程,其具有以下 4 个特点:
- 提供链路追踪:可以很清楚的看出一个请求经过了哪些服务, 可以方便的理清服务间的调用关系
- 性能分析:可以很方便的看到每个请求的耗时,分析出哪些服务调用比较耗时,可以对服务的扩容提供一定的提醒作用
- 数据分析优化链路:可以很清楚的看到微服务之间的依赖关系,分析调用瓶颈,方便针对业务做一些优化措施
- 可视化:结合 zipkin 对数据进行可视化展示,快速排查定位问题,对于微服务调用的异常,也可以在zipkpin界面上看到
本篇博客通过 Demo 介绍 Sleuth 和 Zipkin 的快速使用,在博客最后会提供源代码下载。
ZipKin 的 GitHub 地址为 https://github.com/openzipkin/zipkin
一、搭建环境
我的 CentOS7 虚拟机 ip 地址是 192.168.136.128,已经安装好了 docker 和 docker-compose
我们使用 Spring Cloud Alibaba,使用 nacos 作为注册中心,有关 nacos 的搭建可参考:https://www.cnblogs.com/studyjobs/p/18014237
在虚拟机上创建 zipkin 的目录:mkdir /data/zipkin -p 在目录中创建 docker-compose.yml 文件,内容如下:
version: '3.2'
services:
  zipkin:
    container_name: zipkin
    restart: always
    image: openzipkin/zipkin:latest
    ports:
      - "9411:9411"
    volumes:
      - /etc/localtime:/etc/localtime
之所以将虚拟机的 /etc/localtime 映射到容器内,主要是想让容器内的时区,与虚拟机的时区保持一致,我的虚拟机时区是东8区北京时间。
然后在 docker-compose.yml 目录下,运行 docker-compose up -d 启动 zipkin 可视化服务。
使用 docker-compose logs -f 可以查看 zipkin 的启动日志,可以看到 zipkin 的版本,我目前使用的是最新版本 2.23.16
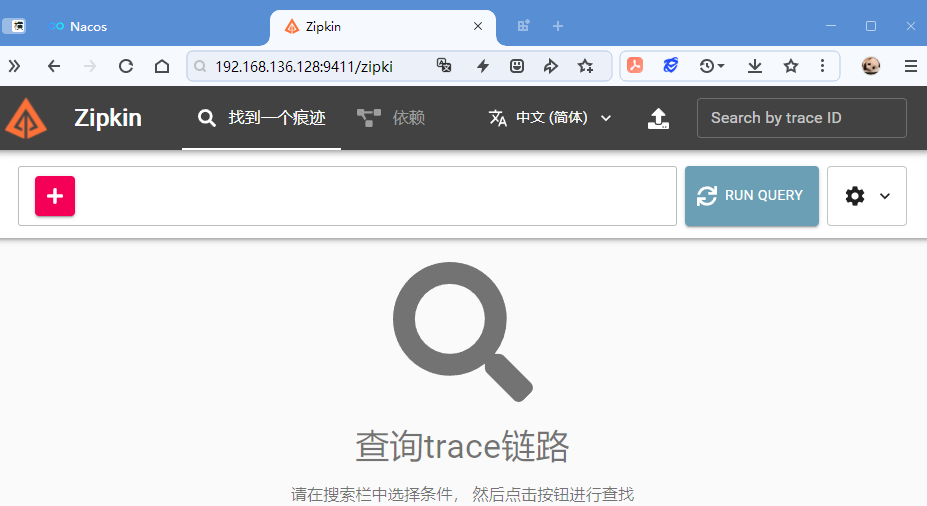
打开浏览器访问 http://192.168.136.128:9411,界面展示如下:
二、搭建工程
创建一个名称为 springcloud_sleuth_zipkin 的工程,结构如下:
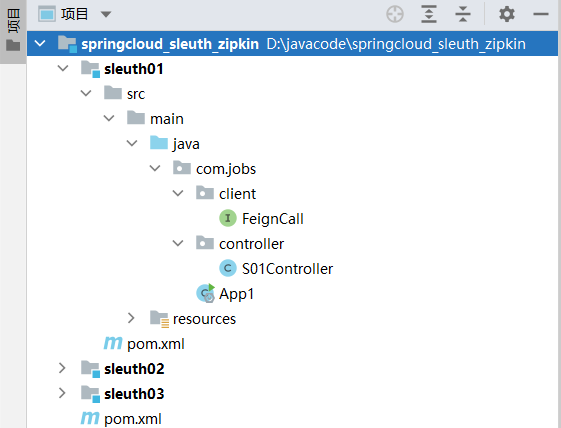
在 springcloud_sleuth_zipkin 父工程下包含 3 个子工程:sleuth01、sleuth02、sleuth03
这 3 个子工程的代码,基本上一样,调用关系是:sleuth01 -> sleuth02 -> sleuth03,最后 sleuth03 处理后返回最终结果。
首先看一下 springcloud_sleuth_zipkin 父工程的 pom 文件:
<?xml version="1.0" encoding="UTF-8"?>
<project xmlns="http://maven.apache.org/POM/4.0.0"
         xmlns:xsi="http://www.w3.org/2001/XMLSchema-instance"
         xsi:schemaLocation="http://maven.apache.org/POM/4.0.0
         http://maven.apache.org/xsd/maven-4.0.0.xsd">
    <modelVersion>4.0.0</modelVersion>

    <groupId>com.jobs</groupId>
    <artifactId>springcloud_sleuth_zipkin</artifactId>
    <version>1.0</version>
    <modules>
        <module>sleuth01</module>
        <module>sleuth02</module>
        <module>sleuth03</module>
    </modules>
    <packaging>pom</packaging>

    <parent>
        <groupId>org.springframework.boot</groupId>
        <artifactId>spring-boot-starter-parent</artifactId>
        <version>2.3.12.RELEASE</version>
    </parent>

    <properties>
        <maven.compiler.source>8</maven.compiler.source>
        <maven.compiler.target>8</maven.compiler.target>
    </properties>

    <dependencyManagement>
        <dependencies>
            <!-- 引入 springCloud 依赖-->
            <dependency>
                <groupId>org.springframework.cloud</groupId>
                <artifactId>spring-cloud-dependencies</artifactId>
                <version>Hoxton.SR10</version>
                <type>pom</type>
                <scope>import</scope>
            </dependency>
            <!--引入 springCloud alibaba 依赖-->
            <dependency>
                <groupId>com.alibaba.cloud</groupId>
                <artifactId>spring-cloud-alibaba-dependencies</artifactId>
                <version>2.2.9.RELEASE</version>
                <type>pom</type>
                <scope>import</scope>
            </dependency>
        </dependencies>
    </dependencyManagement>
    <dependencies>
        <!--由于 zipkin 中已经包含了 sleuth,所以只需要引入 zipkin 依赖即可-->
        <dependency>
            <groupId>org.springframework.cloud</groupId>
            <artifactId>spring-cloud-starter-zipkin</artifactId>
        </dependency>
        <dependency>
            <groupId>org.projectlombok</groupId>
            <artifactId>lombok</artifactId>
        </dependency>
    </dependencies>
</project>
由于 3 个子工程,都需要使用 sleuth 和 zipkin 的依赖包,所以就在父工程的 pom 文件中引用了,子工程就不需要再引用了。
由于 zipkin 的依赖包中,已经包含的 sleuth 的依赖包,所以这里只需要引用 zipkin 依赖包就可以了。
由于 3 个子工程的代码基本一致,都是只有 1 个接口,并通过 openfeign 进行调用,因此详细介绍一个即可,以 sleuth01 为例:
sleuth01 的 pom 文件内容如下,主要是引用 nacos 和 openfeign 的依赖包:
<?xml version="1.0" encoding="UTF-8"?>
<project xmlns="http://maven.apache.org/POM/4.0.0"
         xmlns:xsi="http://www.w3.org/2001/XMLSchema-instance"
         xsi:schemaLocation="http://maven.apache.org/POM/4.0.0 http://maven.apache.org/xsd/maven-4.0.0.xsd">
    <parent>
        <artifactId>springcloud_sleuth_zipkin</artifactId>
        <groupId>com.jobs</groupId>
        <version>1.0</version>
    </parent>
    <modelVersion>4.0.0</modelVersion>

    <artifactId>sleuth01</artifactId>

    <properties>
        <maven.compiler.source>8</maven.compiler.source>
        <maven.compiler.target>8</maven.compiler.target>
    </properties>

    <dependencies>
        <dependency>
            <groupId>org.springframework.boot</groupId>
            <artifactId>spring-boot-starter-web</artifactId>
        </dependency>
        <!--引入 nacos 客户端依赖包-->
        <dependency>
            <groupId>com.alibaba.cloud</groupId>
            <artifactId>spring-cloud-starter-alibaba-nacos-discovery</artifactId>
        </dependency>
        <!--引入 openfeign 依赖包-->
        <dependency>
            <groupId>org.springframework.cloud</groupId>
            <artifactId>spring-cloud-starter-openfeign</artifactId>
        </dependency>
    </dependencies>

    <build>
        <plugins>
            <plugin>
                <groupId>org.springframework.boot</groupId>
                <artifactId>spring-boot-maven-plugin</artifactId>
                <version>2.3.12.RELEASE</version>
            </plugin>
        </plugins>
    </build>
</project>
sleuth01 的 application.yml 配置文件内容如下,重点在于配置 sleuth 的跟踪数据采集率,以及 zipkin 部署的地址
server:
  port: 8091

spring:
  application:
    # 微服务的名称
    name: sleuth01
  cloud:
    nacos:
      # 配置 Nacos 的 ip 和 端口
      server-addr: 192.168.136.128:8848
      # 配置登录的 账号 和 密码
      #username: nacos
      #password: nacos
  sleuth:
    sampler:
      # 这个是跟踪日志的收集比例,1表示 100%,比例越大,越耗费性能
      # 在生产环境中,建议设置为 0.5 以下
      probability: 0.5
  zipkin:
    # sleuth 收集的日志,需要发给 zipkin 进行可视化展示,这里设置 zip 的部署地址
    base-url: http://192.168.136.128:9411

#针对具体的服务,配置使用 nacos 的负载均衡策略(随机策略)
#当前项目中接口提供者的服务名称是 sleuth02
#如果去掉以下的配置,则默认使用 ribbon 的轮训策略
sleuth02:
  ribbon:
    NFLoadBalancerRuleClassName: com.alibaba.cloud.nacos.ribbon.NacosRule
由于要使用 openfeign ,所以启动类上要添加 @EnableFeignClients 注解
package com.jobs;

import lombok.extern.slf4j.Slf4j;
import org.springframework.boot.SpringApplication;
import org.springframework.boot.autoconfigure.SpringBootApplication;
import org.springframework.cloud.openfeign.EnableFeignClients;

@Slf4j
@EnableFeignClients
@SpringBootApplication
public class App1 {
    public static void main(String[] args) {
        SpringApplication.run(App1.class, args);
        log.info("App1 已经启动...");
    }
}
定义 feign 的接口,用于远程调用 sleuth02 微服务提供的接口
package com.jobs.client;

import org.springframework.cloud.openfeign.FeignClient;
import org.springframework.web.bind.annotation.GetMapping;
import org.springframework.web.bind.annotation.RequestParam;

@FeignClient("sleuth02")
public interface FeignCall {

    @GetMapping("/s02/trace02")
    String getData(@RequestParam("name") String name);
}
最后在 controller 中提供接口,用于我们在浏览器上直接访问调用。
package com.jobs.controller;

import com.jobs.client.FeignCall;
import org.springframework.beans.factory.annotation.Autowired;
import org.springframework.web.bind.annotation.GetMapping;
import org.springframework.web.bind.annotation.RequestMapping;
import org.springframework.web.bind.annotation.RequestParam;
import org.springframework.web.bind.annotation.RestController;

@RequestMapping("/s01")
@RestController
public class S01Controller {

    @Autowired
    private FeignCall feignCall;

    @GetMapping("/trace01")
    public String Test(@RequestParam("name") String name) {
        //调用 sleuth02 服务提供的接口
        return feignCall.getData(name);
    }
}
sleuth02 的微服务,与 sleuth01 基本上一样,只不过 sleuth02 调用的是 sleuth03 的接口。
sleuth03 的接口,最终返回处理结果,其接口内容如下:
package com.jobs.controller;

import org.springframework.web.bind.annotation.GetMapping;
import org.springframework.web.bind.annotation.RequestMapping;
import org.springframework.web.bind.annotation.RequestParam;
import org.springframework.web.bind.annotation.RestController;

@RequestMapping("/s03")
@RestController
public class S03Controller {

    @GetMapping("/trace03")
    public String Test(@RequestParam("name") String name) {
        return "Hello " + name;
    }
}
三、验证成果
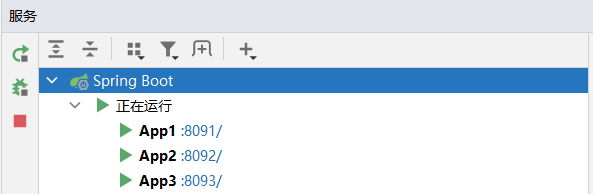
在 IDEA 中启动 3 个微服务,具体端口如下:
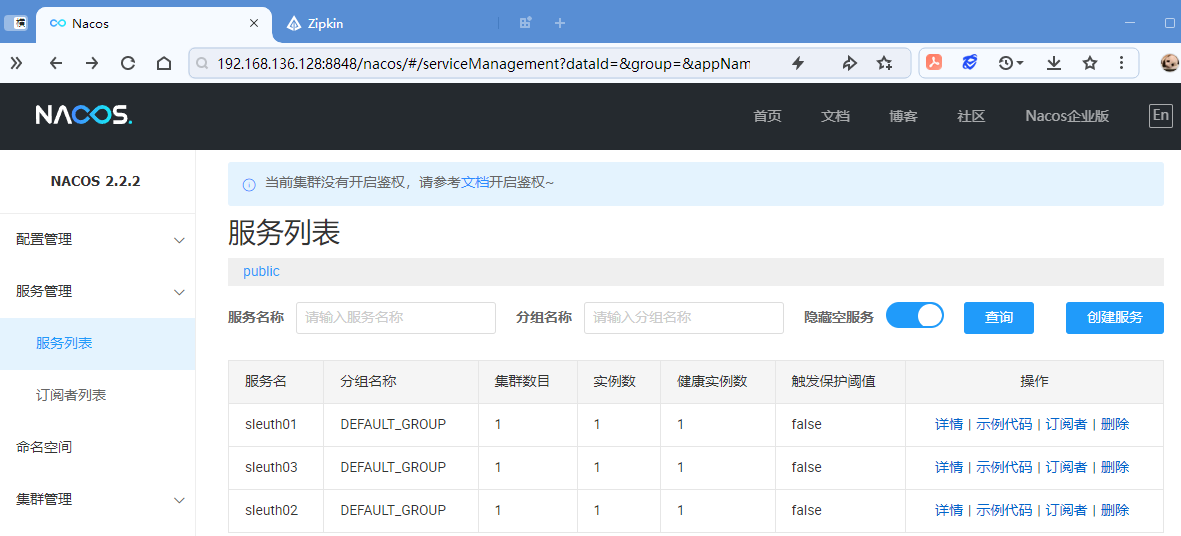
在 nacos 中也可以看到 3 个微服务已经注册成功:
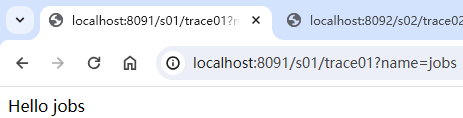
打开浏览器访问 http://localhost:8091/s01/trace01?name=jobs 后,可以看到正常运行的结果:
此时查看 zipkin 的界面,我们就可以看到调用的全链路,以及整体所耗费的时间
注意:此时【持续时间】下面的条颜色是淡青色,说明调用链路没有问题。
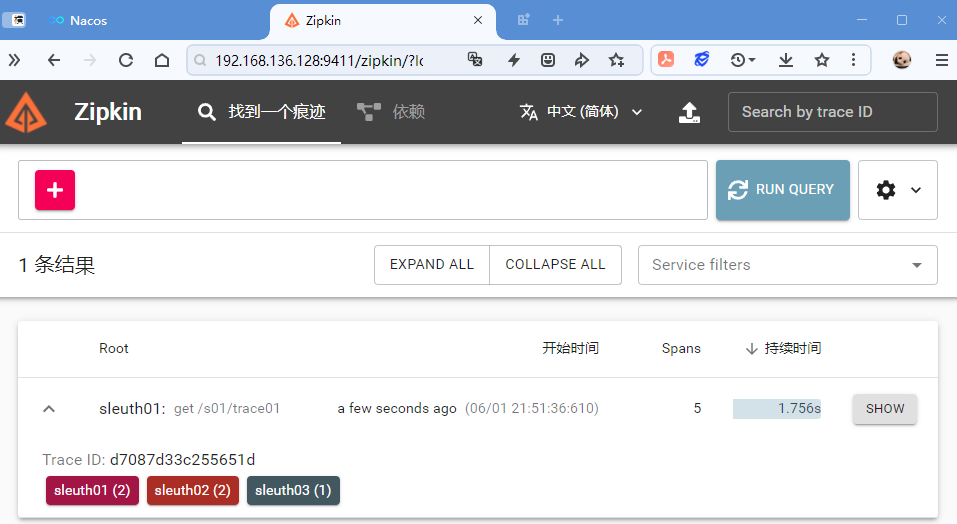
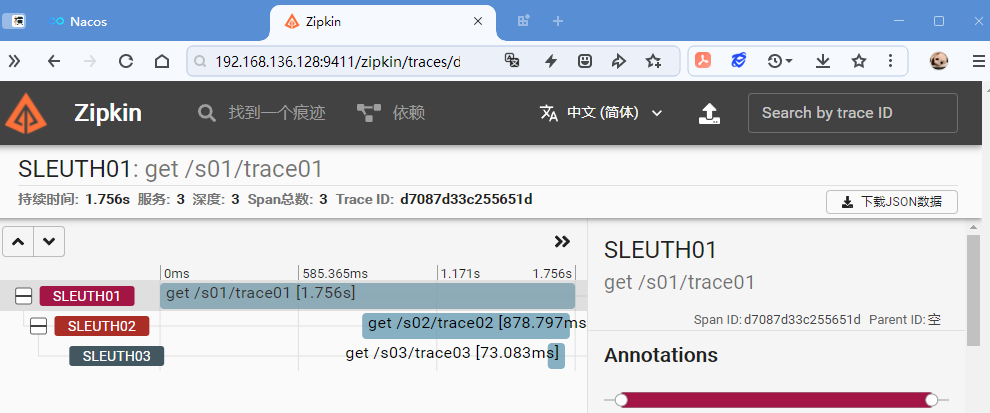
点击 SHOW 按钮,我们可以看到每一步调用所耗费的时间:
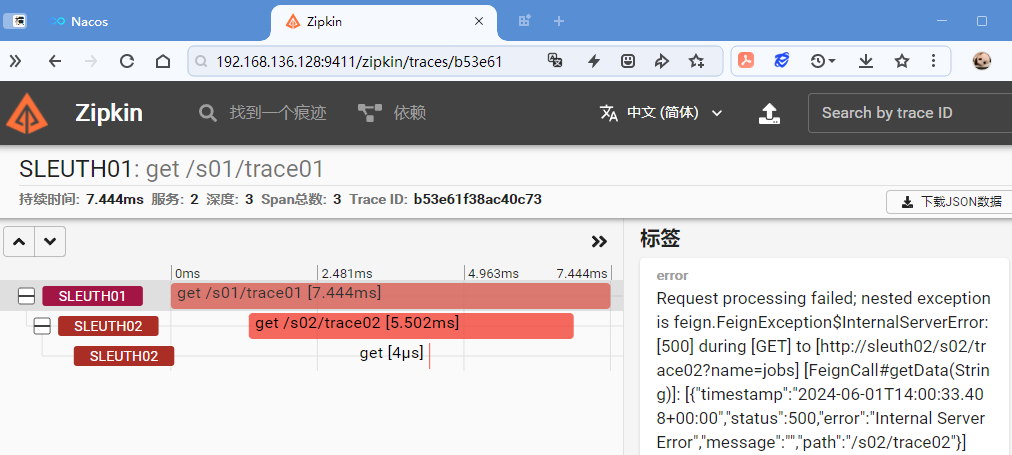
我们可以停掉 sleuth03 服务,然后再进行调用,看看具体的效果
注意:【持续时间】下面的条颜色为淡红色(也会出现无颜色的情况),说明该调用链出现了问题
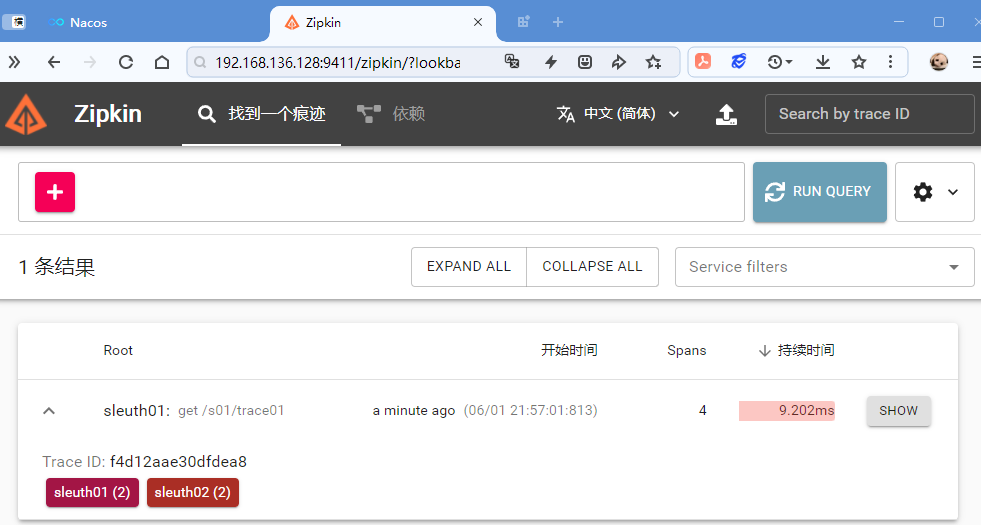
我们发现调用链路中没有 sleuth03 服务,点击 SHOW 按钮进入查看,在右侧提供的错误日志。
点击顶部菜单的【依赖】,在界面中选择合适的时间进行查询,可以看到微服务之间的依赖关系:
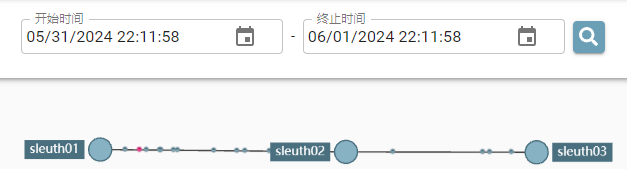
由于我们做的 demo 比较简单,只有 3 个微服务一次调用,因此展示的调用依赖关系也非常简单。
目前我们只是把追踪数据到 zipkin 所在的服务器内存中进行处理和展示,在 zipkin 的 github 上也提供了将追踪数据存储到 mysql 数据库中的方案,但是也说明了并没有针对 mysql 进行性能优化,当追踪信息累积的数据量比较大时就会出现性能问题,因此不推荐数据库存储方案。
本篇博客的源代码下载地址为:https://files.cnblogs.com/files/blogs/699532/springcloud_sleuth_zipkin.zip

 浙公网安备 33010602011771号