echart 悬浮窗超边界了怎么办?
悬浮窗超边界了怎么办?

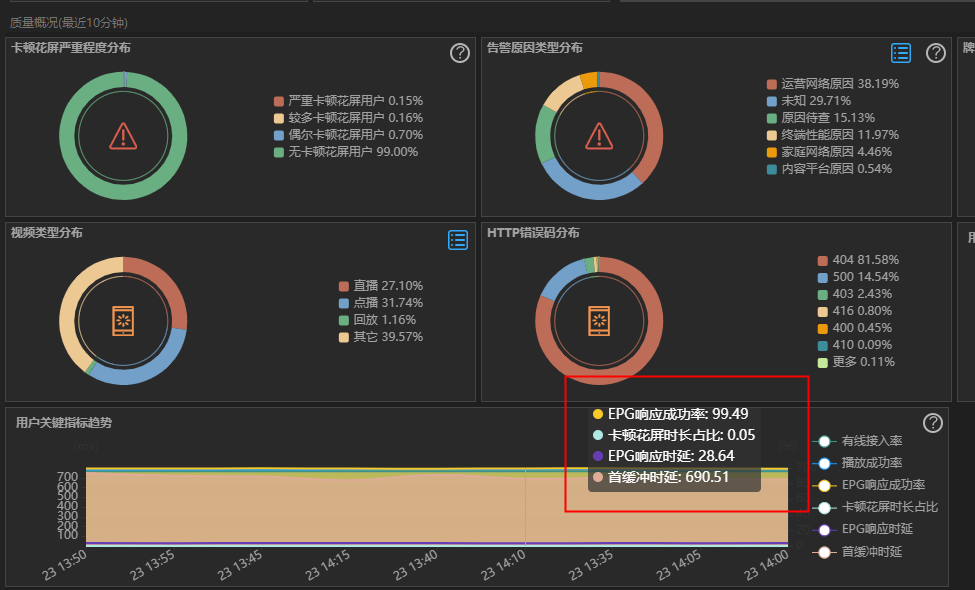
在渲染界面函数里面 写一个
// tooltip浮窗未知
chartOption.tooltip.position = function(point, params, dom, rect, size){
var pos = [point[0]-10, point[1]+10];
var contentSize = size.contentSize, viewSize = size.viewSize;
pos[0] = Math.min(viewSize[0]-contentSize[0], pos[0]);
pos[1] = Math.min(viewSize[1]-contentSize[1], pos[1]);
return pos;
};
效果如下:

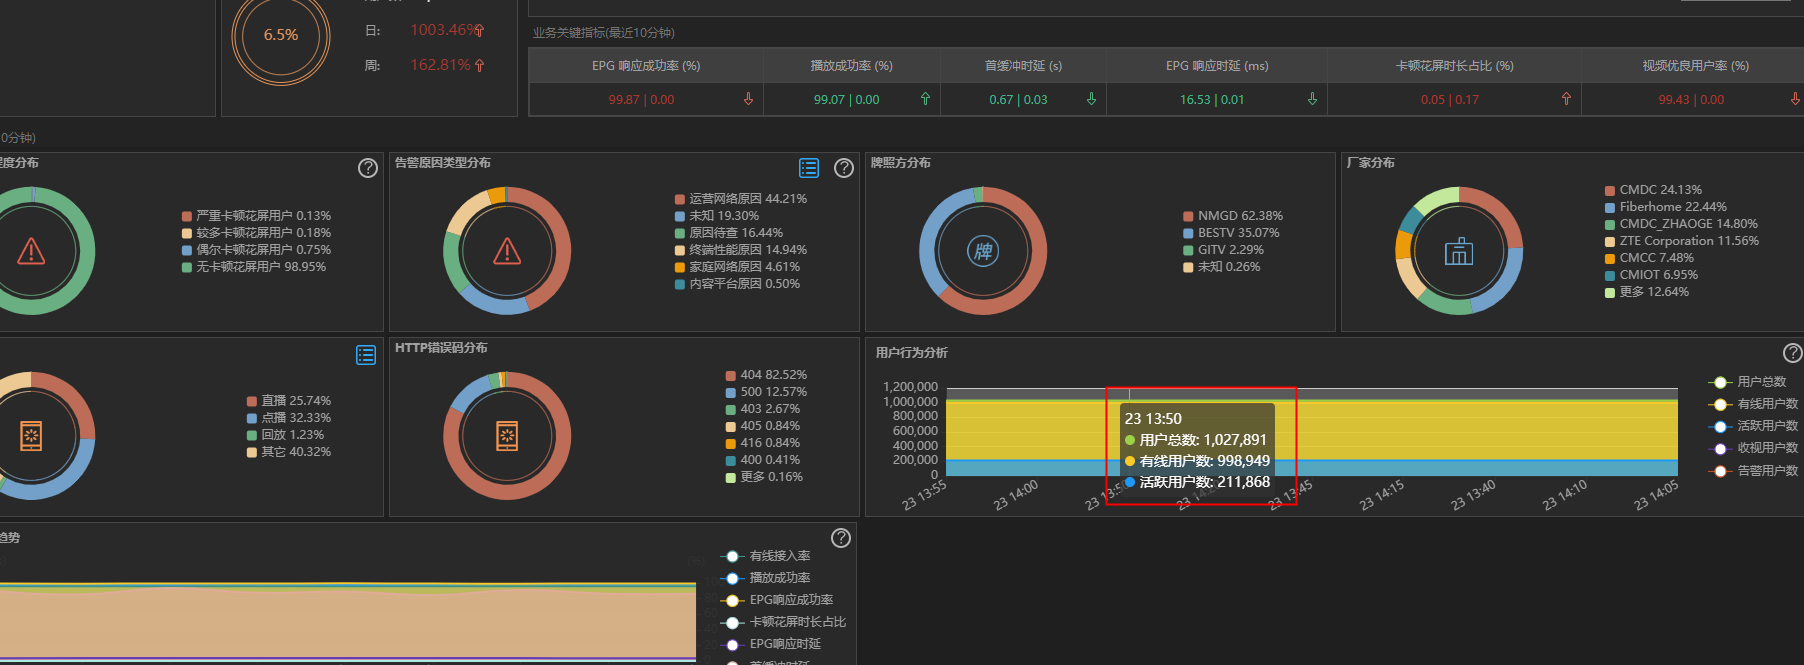
悬浮窗换行
chartOption.tooltip.formatter = function(options) {
if (!options.length) return;
var htmls = [
'<p>'+options[0].name+'</p>',
'<table>',
];
for (var i = 0; i < options.length; i +=3) {
htmls.push('<tr>');
htmls.push('<td>'+
'<span style="width:10px;height:10px;display:inline-block;margin-right:5px;border-radius:5px;background-color:'+options[i].color+';"></span>'+
options[i].seriesName+': '+options[i].value+
'</td>'
);
if (options[i+1]) {
htmls.push('<td style="padding-left:10px;">'+
'<span style="width:10px;height:10px;display:inline-block;margin-right:5px;border-radius:5px;background-color:'+options[i+1].color+';"></span>'+
options[i+1].seriesName+': '+options[i+1].value+
'</td>'
);
} else {
htmls.push('<td></td>');
}
if (options[i+2]) {
htmls.push('<td style="padding-left:10px;">'+
'<span style="width:10px;height:10px;display:inline-block;margin-right:5px;border-radius:5px;background-color:'+options[i+2].color+';"></span>'+
options[i+2].seriesName+': '+options[i+2].value+
'</td>'
);
} else {
htmls.push('<td></td>');
}
htmls.push('</tr>');
}
htmls.push('</table>');
return htmls.join('');
};


