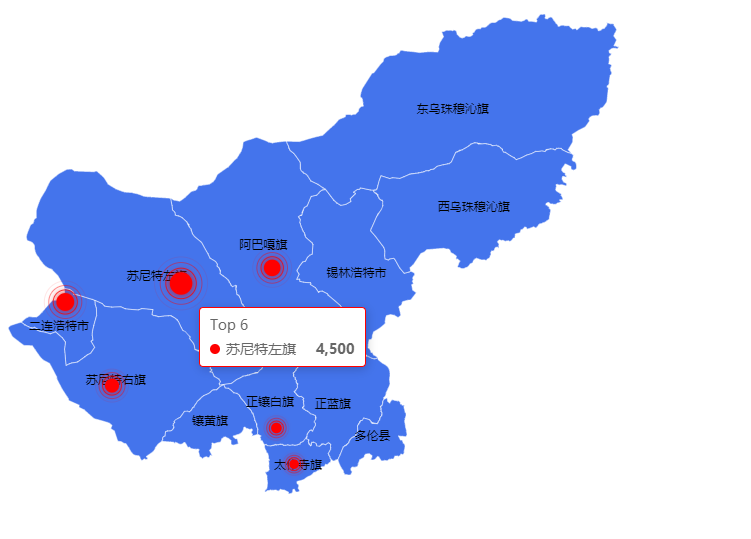
vue-cli使用echarts系列之涟漪效果地图effectScatter

实现步骤
1.下载地图json数据到项目中,我的地图下载地址http://datav.aliyun.com/tools/atlas/#&lat=30.316551722910077&lng=106.68898666525287&zoom=3.5
2.在项目中引入
import xilinguole from '@/utils/map/xilinguole.json' // 有子级区域
3.提供echarts展示的DOM元素,注册地图
<template>
  <div class="container">
    <div id="lineChart" style="height:500px"></div>
  </div>
</template>

<script>
import xilinguole from '@/utils/map/xilinguole.json' // 有下级区域
// import xilinguole from '@/utils/map/xilinguo2.json' // 无下级区域

export default {
  name: 'effectScatter',
  data() {
    return {
      option: {
        tooltip: {},
        geo: {
          map: 'city',
          zoom: 1.2,
          roam: true,
          itemStyle: {
            areaColor: '#4474ec', // 区域颜色
            borderColor: '#fff' // 区域边线颜色
          },
          label: {
            show: true // 是否展示名称
          },
          emphasis: {
            label: {
              // show: false
            },
            itemStyle: {
              areaColor: '#4474ec', // 高亮时区域颜色
            }
          }
        }
      },
      mapChart: ''
    }
  },
   mounted() {
    this.getMapChart()
  },
  methods: {
    // echarts初始化
    getMapChart() {
      this.mapChart = this.$echart.init(document.getElementById('lineChart'))

      this.$echart.registerMap('city', xilinguole);
      this.mapChart.setOption(this.option)
    }
  }
}
</script>
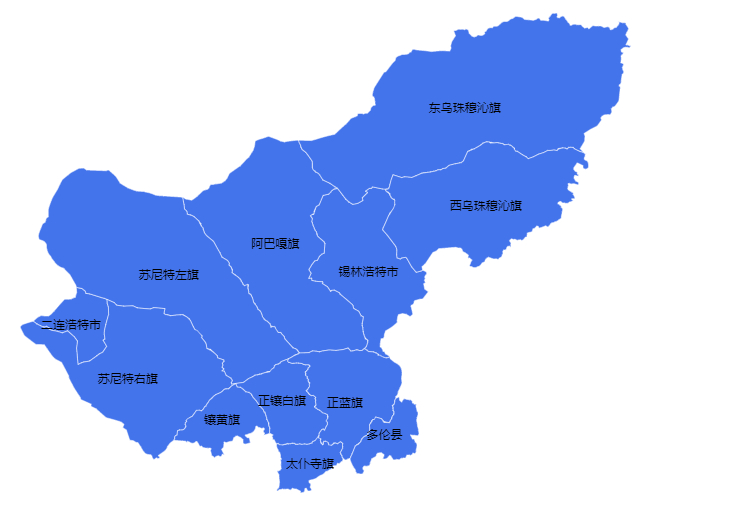
4.完成第三步就能在页面中看到地图了

5.增加涟漪效果, data中value数据的坐标就是下载的地图json数据中的center数值
series: [
      { // 涟漪效果
      name: 'Top 6',
      type: 'effectScatter',
      coordinateSystem: 'geo', // 该系列使用的坐标系
      data: [{ // 数据映射
        name: "苏尼特左旗", // 对应地图中的name
        value: [113.653412, 43.854108, 4500] // value值,前面两个是X轴,Y轴坐标, 后面的数据自定义,可以设置多个
        },
        {
        name: "二连浩特市",
        value: [111.97981, 43.652895, 3560]
        },
        {
        name: "阿巴嘎旗",
        value: [114.970618, 44.022728, 3300]
        },
        {
        name: "苏尼特右旗",
        value: [112.65539, 42.746662, 2800]
        },
        {
        name: "正镶白旗",
        value: [115.031423, 42.286807, 2100]
        },
        {
        name: "太仆寺旗",
        value: [115.28728, 41.895199, 1900]
        }
      ],
      symbolSize: function (val) { // 涟漪图大小 val就是data中value数组
          return val[2] / 200;
      },
      encode: {
          value: 2 // 可以定义 data 的哪个维度被编码成什么.这里的意思是把data数据的第2项(从0开始)编译为value
      },
      showEffectOn: 'render', // 配置何时显示特效
      rippleEffect: {
          brushType: 'stroke',
          color: 'red'
      },
      emphasis: {
        scale: false
      },
      label: {
          formatter: '{b}',
          position: 'right',
          show: false
      },
      itemStyle: {
          shadowBlur: 10,
          shadowColor: 'rgba(230, 10, 10, 1)',
          color: 'red'
      },
      zlevel: 1
    }
  ]
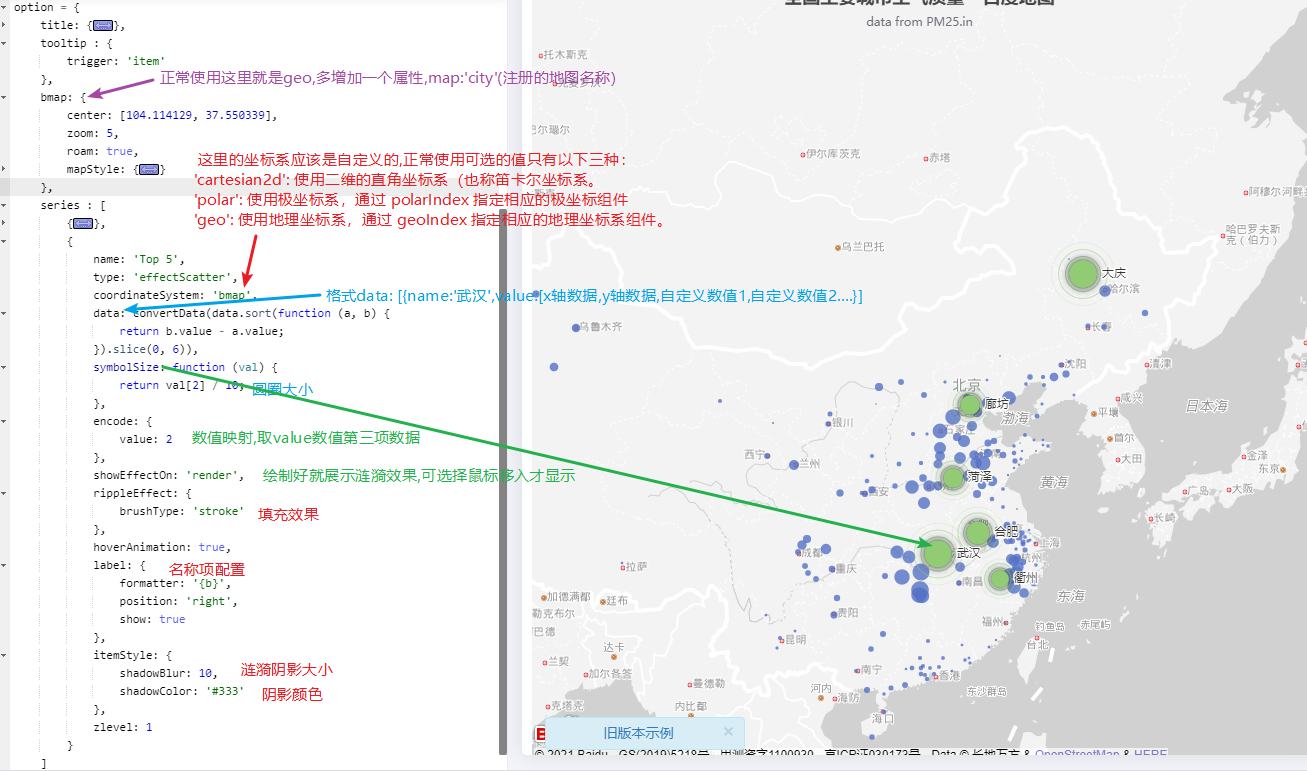
6.这样就完成一个涟漪效果的地图了,以官网的地图为例,https://echarts.apache.org/examples/zh/editor.html?c=effectScatter-bmap看一下配置对应的效果

完整代码:
<template>
  <div class="container">
    <div id="lineChart" style="height:500px"></div>
  </div>
</template>

<script>
import xilinguole from '@/utils/map/xilinguole.json' // 有下级区域
// import xilinguole from '@/utils/map/xilinguo2.json' // 无下级区域

export default {
  name: 'effectScatter',
  data() {
    return {
      option: {
        tooltip: {},
        geo: {
          map: 'city',
          zoom: 1.2,
          roam: true,
          itemStyle: {
            areaColor: '#4474ec',
            borderColor: '#fff'
          },
          label: {
            show: true
          },
          emphasis: {
            label: {
              // show: false
            },
            itemStyle: {
              areaColor: '#4474ec',
            }
          }
        },
        series: [
           { // 涟漪效果
            name: 'Top 6',
            type: 'effectScatter',
            coordinateSystem: 'geo',
            data: [{
              name: "苏尼特左旗",
              value: [113.653412, 43.854108, 4500]
              },
              {
              name: "二连浩特市",
              value: [111.97981, 43.652895, 3560]
              },
              {
              name: "阿巴嘎旗",
              value: [114.970618, 44.022728, 3300]
              },
              {
              name: "苏尼特右旗",
              value: [112.65539, 42.746662, 2800]
              },
              {
              name: "正镶白旗",
              value: [115.031423, 42.286807, 2100]
              },
              {
              name: "太仆寺旗",
              value: [115.28728, 41.895199, 1900]
              }
            ],
            symbolSize: function (val) {
                return val[2] / 200;
            },
            encode: {
                value: 2
            },
            showEffectOn: 'render',
            rippleEffect: {
                brushType: 'stroke',
                color: 'red'
            },
            emphasis: {
              scale: false
            },
            label: {
                formatter: '{b}',
                position: 'right',
                show: false
            },
            itemStyle: {
                shadowBlur: 10,
                shadowColor: 'rgba(230, 10, 10, 1)',
                color: 'red'
            },
            zlevel: 1
          }
        ]
      },
      mapChart: ''
    }
  },
   mounted() {
    this.getMapChart()
  },
  methods: {
    // echarts初始化
    getMapChart() {
      this.mapChart = this.$echart.init(document.getElementById('lineChart'))

      this.$echart.registerMap('city', xilinguole);
      this.mapChart.setOption(this.option)

    }
  }
}
</script>


