
vue使用echarts修改属性后图表没有更新
在vue-cli创建的项目中 使用echarts
修改部分配置
<template>
<div class="line-container">
<ul class="attribute-list clearfix">
<li class="item">
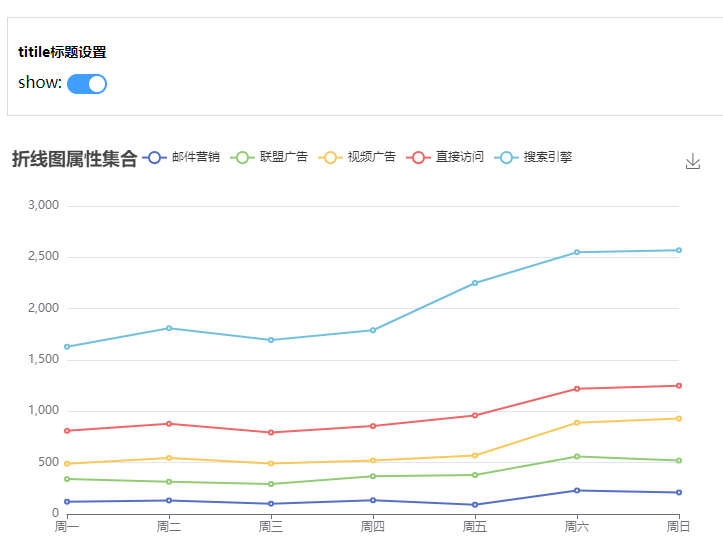
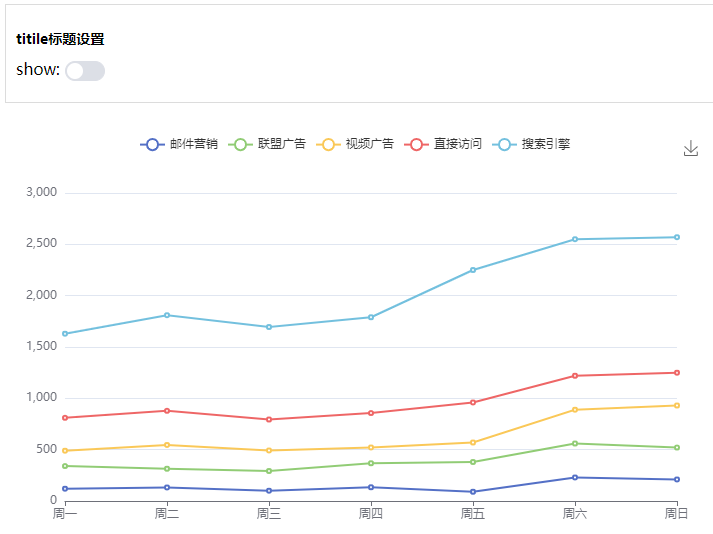
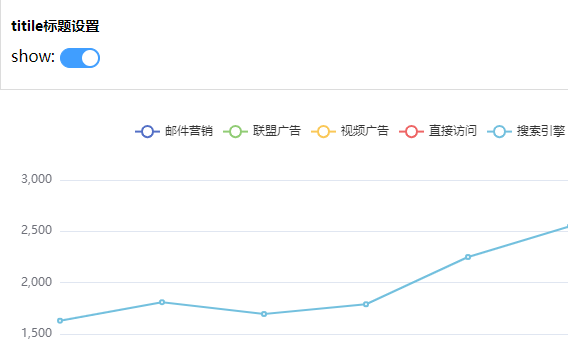
<span class="title">titile标题设置</span>
<ul class="clearfix">
<li class="subItem">
<span>show: </span>
<el-switch v-model="title.show" @change="onChange1" />
</li>
</ul>
</li>
</ul>
<div>
<div id="lineChart"></div>
</div>
</div>
</template>
export default {
name: 'lineChart',
data(){
return {
option: {
title: { text: '折线图属性集合' },
tooltip: {
trigger: 'axis'
},
legend: {
data: ['邮件营销', '联盟广告', '视频广告', '直接访问', '搜索引擎']
},
grid: {
left: '3%',
right: '4%',
bottom: '3%',
containLabel: true
},
toolbox: {
feature: {
saveAsImage: {}
}
},
xAxis: {
type: 'category',
boundaryGap: false,
data: ['周一', '周二', '周三', '周四', '周五', '周六', '周日']
},
yAxis: {
type: 'value'
},
series: [
{
name: '邮件营销',
type: 'line',
stack: '总量',
data: [120, 132, 101, 134, 90, 230, 210]
},
{
name: '联盟广告',
type: 'line',
stack: '总量',
data: [220, 182, 191, 234, 290, 330, 310]
},
{
name: '视频广告',
type: 'line',
stack: '总量',
data: [150, 232, 201, 154, 190, 330, 410]
},
{
name: '直接访问',
type: 'line',
stack: '总量',
data: [320, 332, 301, 334, 390, 330, 320]
},
{
name: '搜索引擎',
type: 'line',
stack: '总量',
data: [820, 932, 901, 934, 1290, 1330, 1320]
}
]
},
lineChart: '',
title: {
text: '',
left: 0,
show: true,
textStyle: {
color: '#333',
fontSize: '18'
}
}
}
},
created() {},
mounted() {
this.getLineChart()
},
methods: {
// 设置折线图
getLineChart() {
this.lineChart = this.$echart.init(document.getElementById('lineChart'))
this.lineChart.setOption(this.option)
},
/** --------------------title相关设置开始------------------ */
// 标题展示
onChange1() {
this.option.title = this.title
console.log(this.option)
this.lineChart.setOption(this.option)
},
}
}
</script>
这样设置后,只有第一次操作有效果,后面就没有效果了
解决方法
修改echarts的option不能赋值data里定义的对象,因为对象的=赋值会改变option的数组存储,可以赋值对象里的属性值
可以直接修改option的属性, 遇到其他数据型修改,可以把setOption第二参数,传true,第二个参数是 notMerge: 是否不跟之前设置的 option 进行合并,默认为 false,即合并
// 标题展示
    onChange1(checked) {
      this.option.title.show = checked // 或者赋值对象里具体的属性值 this.option.title.show = this.title.show
      console.log(this.option)
      this.lineChart.setOption(this.option) // this.lineChart.setOption(this.option, true)

    },

 浙公网安备 33010602011771号