
xAxis中type: 'time' 时间轴日期折线图实现
最终效果图:
实现步骤:
一般图表的数据都是由后台返回的,所以这里写了个getData函数,可以在这里获取后台接口数据
type: time时需要的数据是二维数组格式,[[x, y],[x, y]] x为时间 y数值
需要注意的是: 如果某些日期没有数值,也需要把这一项填充,y值为空,不然展示时空数据的地方会有问题
const lineChart = echarts.init(document.getElementById('lineChart'));
    const lineOption = {
      title: {
          text: '网站访问渠道统计'
      },
      tooltip: {
          trigger: 'axis',
      },
      legend: {
          data: []
      },
      grid: {
          left: '3%',
          right: '4%',
          bottom: '3%',
          containLabel: true
      },
      toolbox: {
          feature: {
              saveAsImage: {}
          }
      },
      xAxis: {
          type: 'time', // type为time时,不要传xAxis.data的值,x轴坐标的数据会根据传入的时间自动展示
          boundaryGap: false, // false横坐标两边不需要留白
      },
      yAxis: {
          type: 'value',
          name: '访问人数'
      },
      series: []
    };
    // 获取动态数据的函数
    getData()
    function getData() {
      const data = [
        {
          type: 'email',
          name: '邮件营销',
          data: [
            ['2020-10-1', 450],
            ['2020-10-2', 350],
            ['2020-10-3', 290],
            ['2020-10-4', 380],
            ['2020-10-5', 540],
            ['2020-10-6', null],
            ['2020-10-7', null],
            ['2020-10-8', 430],
            ['2020-10-9', 330],
            ['2020-10-10', 280],
            ['2020-10-11', 340],
            ['2020-10-12', 455],
            ['2020-10-13', 330],
          ]
        },
        {
          type: 'ad',
          name: '联盟广告',
          data: [
            ['2020-10-1', 50],
            ['2020-10-2', 150],
            ['2020-10-3', 100],
            ['2020-10-4', 140],
            ['2020-10-5', 141],
            ['2020-10-6', 66],
            ['2020-10-7', 78],
            ['2020-10-8', 67],
            ['2020-10-9', 55],
            ['2020-10-10', 80],
            ['2020-10-11', 40],
            ['2020-10-12', 120],
            ['2020-10-13', 130],
          ]
        },
        {
          type: 'video',
          name: '视频广告',
          data: [
            ['2020-10-1', 234],
            ['2020-10-2', 254],
            ['2020-10-3', 260],
            ['2020-10-4', 270],
            ['2020-10-5', 250],
            ['2020-10-6', 277],
            ['2020-10-7', 289],
            ['2020-10-8', 240],
            ['2020-10-9', 230],
            ['2020-10-10', 222],
            ['2020-10-11', 244],
            ['2020-10-12', 254],
            ['2020-10-13', 279],
          ]
        },
        {
          type: 'offline',
          name: '直接访问',
          data: [
            ['2020-10-1', null],
            ['2020-10-2', null],
            ['2020-10-3', null],
            ['2020-10-4', 40],
            ['2020-10-5', 80],
            ['2020-10-6', 87],
            ['2020-10-7', 98],
            ['2020-10-8', 33],
            ['2020-10-9', 35],
            ['2020-10-10', 78],
            ['2020-10-11', 48],
            ['2020-10-12', 67],
            ['2020-10-13', 30],
          ]
        }
      ]
      const series = []
      const legendData = []
      data.forEach(item => {
        const obj = {
          name: item.name,
          type: 'line',
          data: item.data
        }
        legendData.push(item.name)
        series.push(obj)
      })
      lineOption.legend.data = legendData
      lineOption.series = series
      // 第二个参数true表示清空之前的echarts设置,重新设置option,适用于legend等数据变化
      // 如果只是渲染数据变化可以不传,lenged等不会重新渲染
      lineChart.setOption(lineOption, true)
    }
这样就实现了一个基本的日期折线图,但是这些展示的样式都是默认样式,如果你的UI给你设计了漂亮的图表,那么就需要修改配置了
这里展示几个常见的修改
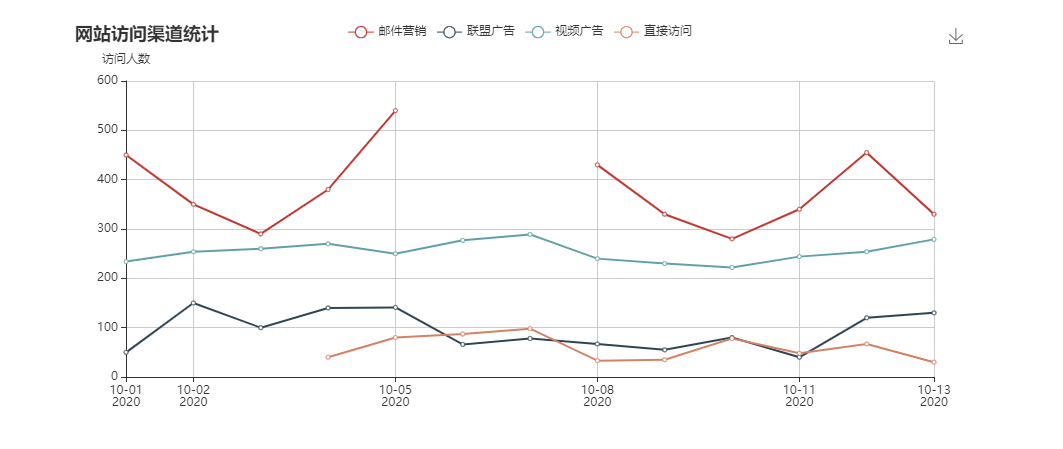
x轴展示日期格式改变,改成YYYY-MM-dd格式
修改lineOption的xAxis配置,增加formatter函数处理
xAxis: {
          type: 'time', // type为time时,不要传xAxis.data的值,x轴坐标的数据会根据传入的时间自动展示
          boundaryGap: false, // false横坐标两边不需要留白
          axisLabel: { // 坐标轴标签样式设置
            formatter: function(value, index) { // 坐标轴文字展示样式处理
              const date = new Date(value)
              const texts = [date.getFullYear(), (date.getMonth() + 1), date.getDate()]
              return texts.join('-')
              // echarts自带的日期格式化方法
              // return echarts.format.formatTime('yyyy-MM-dd', value)
            }
          }
      }
这里我打印了formatter函数的value和 index,其实返回的就是data数据里的日期,界面有展示日期的地方就有index,没展示出来的index为null
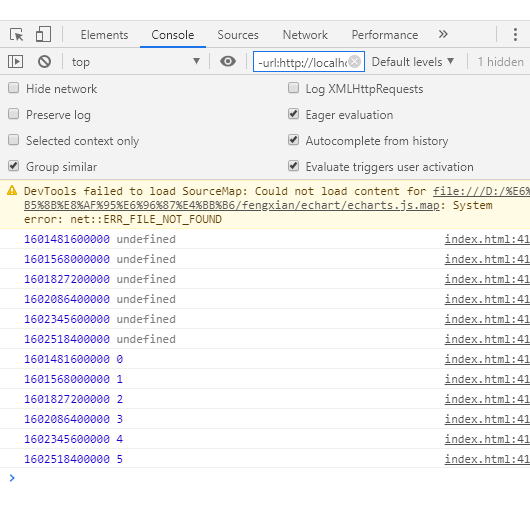
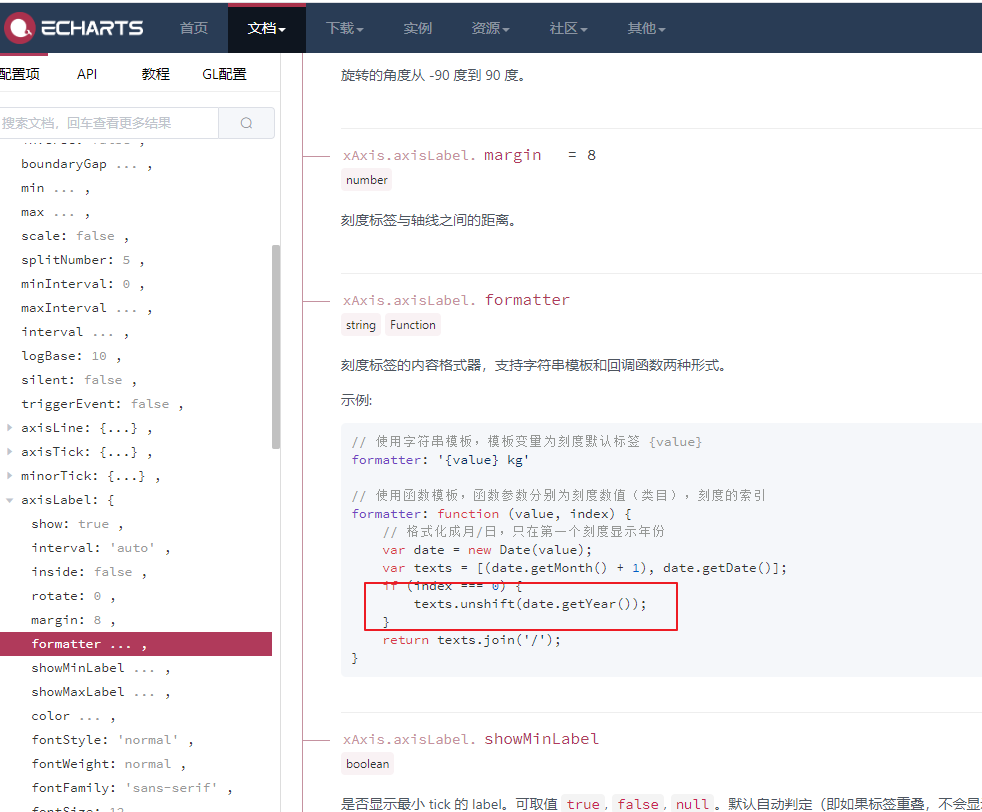
这里提一下官网的一个小问题,官网这里获取年份用的是getYear()方法,但是现在使用这个方法得不到正确的年份,需要改成getFullYear()方法
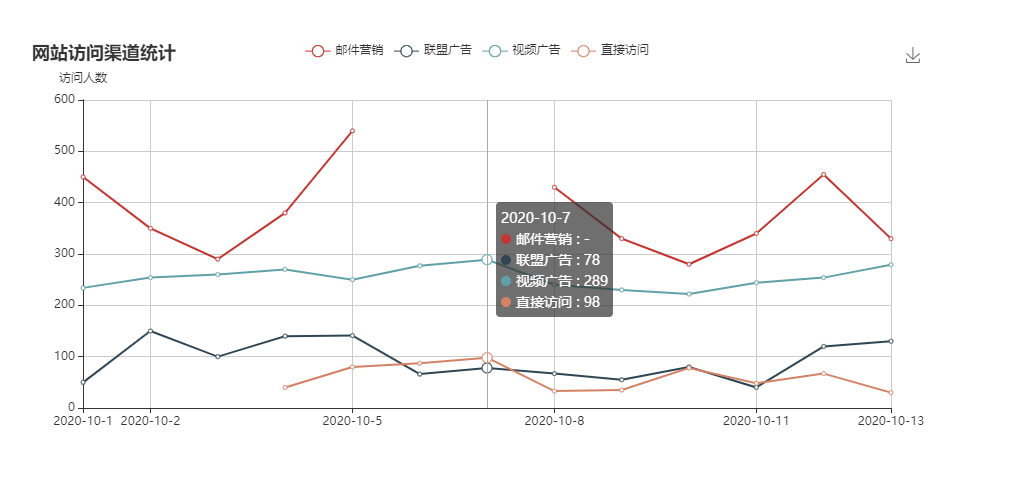
这样处理后日期格式就改好了,接着发现鼠标移入图表的提示框展示需要优化,日期格式修改,没有数值的地方需要处理
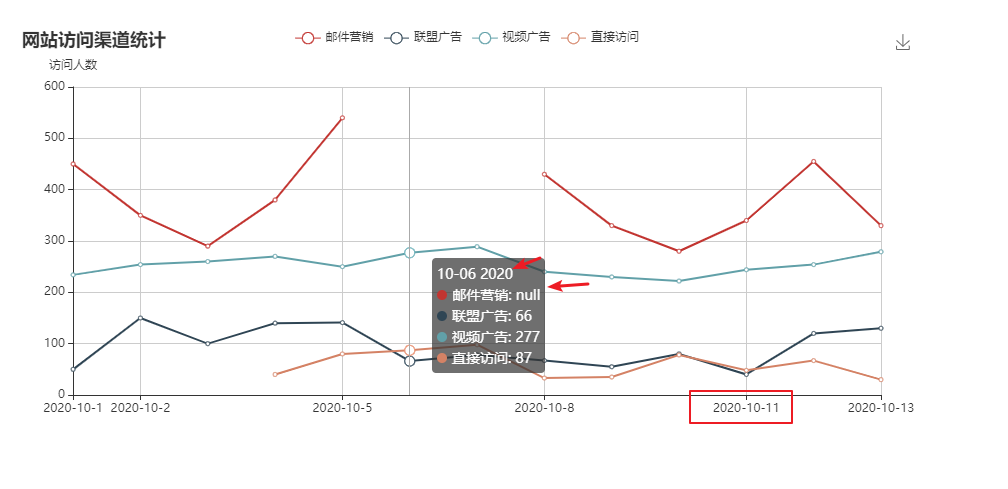
修改tooltip提示框组件的展示
tooltip: {
          trigger: 'axis',
          formatter: function(params) {
            var text = '--'
            if (params && params.length) {
              text = params[0].data[0] // 提示框顶部的日期标题
              params.forEach(item => {
                const dotHtml = item.marker // 提示框示例的小圆圈,可以在这里修改
                text += `</br>${dotHtml}${item.seriesName} : ${item.data[1] ? item.data[1] : '-'}`
              })
            }
            return text
          }
      },
这里的params也打印了,看一下这个结构,我们可以根据这些值自己定制样式
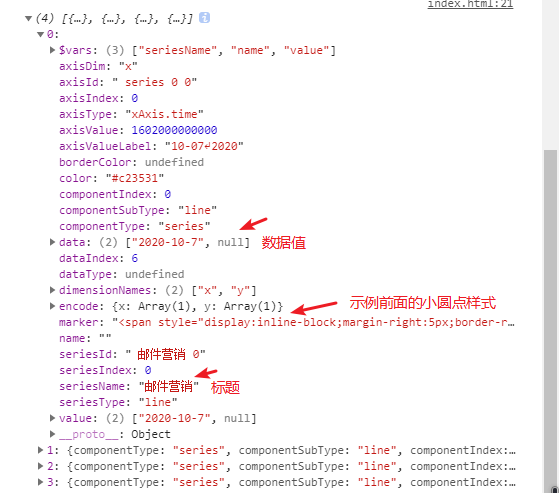
OK,经过这一波处理,提示框的展示也解决了,完美
其他的样式修改大致也是这样,echart还提供了许多其他的样式修改,如颜色,字体等,可以多看看文档,还是很完整的
放一下完整代码,直接新建HTML文件打开就行,前提是你自己下载echarts.js哈
<!DOCTYPE html>
<html lang="en">
<head>
  <meta charset="UTF-8">
  <meta name="viewport" content="width=device-width, initial-scale=1.0">
  <title>Document</title>
  <script src="./echart/echarts.js"></script>
</head>
<body>
  <div id='lineChart' style='width:900px;height:400px;margin:50px auto'></div>
  <script>

    const lineChart = echarts.init(document.getElementById('lineChart'));
    const lineOption = {
      title: {
          text: '网站访问渠道统计'
      },
      tooltip: {
          trigger: 'axis',
          formatter: function(params) {
            var text = '--'
            if (params && params.length) {
              text = params[0].data[0] // 提示框顶部的日期标题
              params.forEach(item => {
                const dotHtml = item.marker // 提示框示例的小圆圈,可以在这里修改
                text += `</br>${dotHtml}${item.seriesName} : ${item.data[1] ? item.data[1] : '-'}`
              })
            }
            return text
          }
      },
      legend: {
          data: []
      },
      grid: {
          left: '3%',
          right: '4%',
          bottom: '3%',
          containLabel: true
      },
      toolbox: {
          feature: {
              saveAsImage: {}
          }
      },
      xAxis: {
          type: 'time', // type为time时,不要传xAxis.data的值,x轴坐标的数据会根据传入的时间自动展示
          boundaryGap: false, // false横坐标两边不需要留白
          axisLabel: { // 坐标轴标签样式设置
            formatter: function(value, index) { // 坐标轴文字展示样式处理
              const date = new Date(value)
              const texts = [date.getFullYear(), (date.getMonth() + 1), date.getDate()]
              return texts.join('-')
              // echarts自带的日期格式化方法
              // return echarts.format.formatTime('yyyy-MM-dd', value)
            }
          }
      },
      yAxis: {
          type: 'value',
          name: '访问人数'
      },
      series: []
    };
    // 获取动态数据的函数
    getData()
    function getData() {
      const data = [
        {
          type: 'email',
          name: '邮件营销',
          data: [
            ['2020-10-1', 450],
            ['2020-10-2', 350],
            ['2020-10-3', 290],
            ['2020-10-4', 380],
            ['2020-10-5', 540],
            ['2020-10-6', null],
            ['2020-10-7', null],
            ['2020-10-8', 430],
            ['2020-10-9', 330],
            ['2020-10-10', 280],
            ['2020-10-11', 340],
            ['2020-10-12', 455],
            ['2020-10-13', 330],
          ]
        },
        {
          type: 'ad',
          name: '联盟广告',
          data: [
            ['2020-10-1', 50],
            ['2020-10-2', 150],
            ['2020-10-3', 100],
            ['2020-10-4', 140],
            ['2020-10-5', 141],
            ['2020-10-6', 66],
            ['2020-10-7', 78],
            ['2020-10-8', 67],
            ['2020-10-9', 55],
            ['2020-10-10', 80],
            ['2020-10-11', 40],
            ['2020-10-12', 120],
            ['2020-10-13', 130],
          ]
        },
        {
          type: 'video',
          name: '视频广告',
          data: [
            ['2020-10-1', 234],
            ['2020-10-2', 254],
            ['2020-10-3', 260],
            ['2020-10-4', 270],
            ['2020-10-5', 250],
            ['2020-10-6', 277],
            ['2020-10-7', 289],
            ['2020-10-8', 240],
            ['2020-10-9', 230],
            ['2020-10-10', 222],
            ['2020-10-11', 244],
            ['2020-10-12', 254],
            ['2020-10-13', 279],
          ]
        },
        {
          type: 'offline',
          name: '直接访问',
          data: [
            ['2020-10-1', null],
            ['2020-10-2', null],
            ['2020-10-3', null],
            ['2020-10-4', 40],
            ['2020-10-5', 80],
            ['2020-10-6', 87],
            ['2020-10-7', 98],
            ['2020-10-8', 33],
            ['2020-10-9', 35],
            ['2020-10-10', 78],
            ['2020-10-11', 48],
            ['2020-10-12', 67],
            ['2020-10-13', 30],
          ]
        }
      ]
      const series = []
      const legendData = []
      data.forEach(item => {
        const obj = {
          name: item.name,
          type: 'line',
          data: item.data
        }
        legendData.push(item.name)
        series.push(obj)
      })
      lineOption.legend.data = legendData
      lineOption.series = series
      // 第二个参数true表示清空之前的echarts设置,重新设置option,适用于legend等数据变化
      // 如果只是渲染数据变化可以不传,lenged等不会重新渲染
      lineChart.setOption(lineOption, true)
    }
  </script>
</body>
</html>

 浙公网安备 33010602011771号