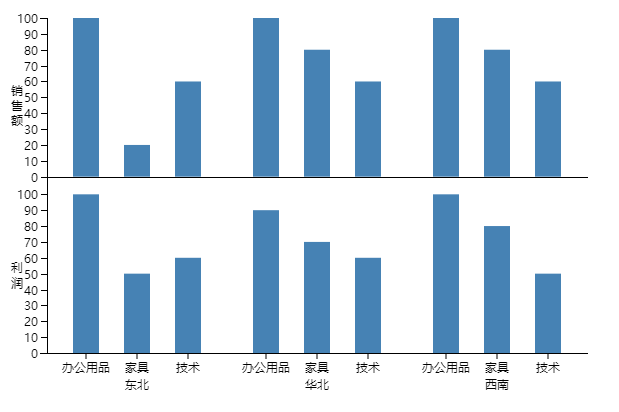
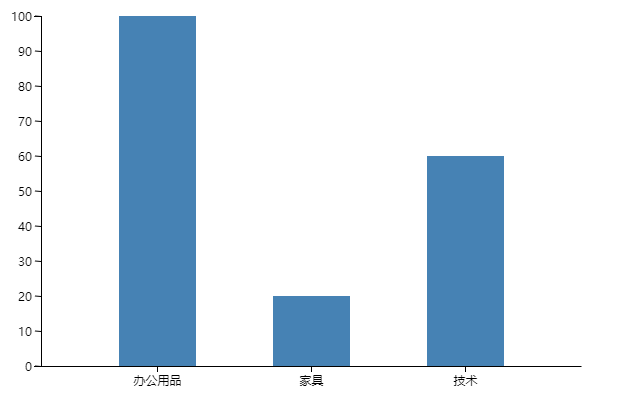
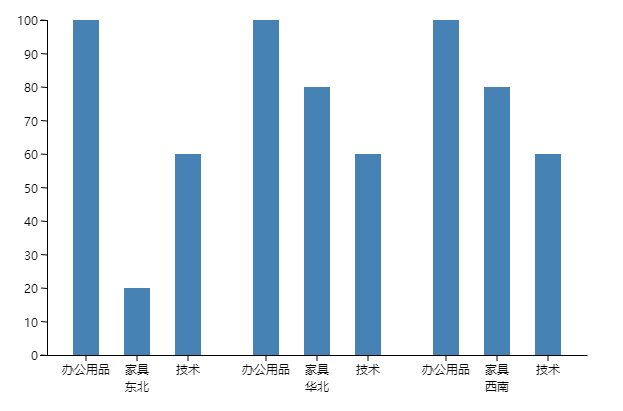
最终效果图镇楼:

本文通过三个步骤来介绍d3.js。
1、简单的柱状图;
2、多个x轴的柱状图;
3、多个x轴、y轴的柱状图;
学习心得:
d3.js入门相对比较困难,一旦掌握了核心思想,不断熟悉API,就可以做出很灵活、实用的图表。
canvas中,d3帮我们计算好了每个图形的位置,我们再一个一个的画上即可。
不要担心代码看起来很多,一个一个的分析出来,就会发现其实还是有套路的。
一、简单图表
示意图:

代码:
<!DOCTYPE html>
<html lang="en">
<head>
  <meta charset="UTF-8">
  <title></title>
</head>
<body>
<canvas id="myCanvas" width="600" height="400"></canvas>
<script src="d3.min.js"></script>
<script>
  "use strict";
  (function () {
    function init() {
      initData();
    }
    function initData() {var oneData = [
        {'name': '办公用品', 'value': 100},
        {'name': '家具', 'value': 20},
        {'name': '技术', 'value': 60}
      ];
      initUI(oneData);
    }
    function initUI(data) {
      var canvas = document.querySelector('#myCanvas');
      var context = canvas.getContext('2d');
      var margin = {top: 20, right: 20, bottom: 30, left: 40};
      var width = canvas.width - margin.left - margin.right;
      var height = canvas.height - margin.top - margin.bottom;
      var x0 = d3.scaleBand()
        .domain(data.map(function (d) {
          return d.name;
        }))
        .rangeRound([0, width])
        .padding(0.5);
      var y0 = d3.scaleLinear()
        .domain([0, d3.max(data, function (d) {
          return d.value;
        })])
        .range([height, 0]);
      context.translate(margin.left, margin.top);
      context.beginPath();
      x0.domain().forEach(function (d) {
        context.moveTo(x0(d) + x0.bandwidth() / 2, height);
        context.lineTo(x0(d) + x0.bandwidth() / 2, height + 6);
      });
      context.strokeStyle = 'black';
      context.stroke();
      context.textAlign = "center";
      context.textBaseline = "top";
      x0.domain().forEach(function (d) {
        context.fillText(d, x0(d) + x0.bandwidth() / 2, height + 6);
      });
      context.beginPath();
      context.moveTo(0.5, height + 0.5);
      context.lineTo(width + 0.5, height + 0.5);
      context.strokeStyle = "black";
      context.stroke();
      var yTickCount = 10;
      var yTicks = y0.ticks(yTickCount);
      context.beginPath();
      yTicks.forEach(function (d) {
        context.moveTo(0, y0(d) + 0.5);
        context.lineTo(-6, y0(d) + 0 / 5);
      });
      context.strokeStyle = 'black';
      context.stroke();
      context.textAlign = "right";
      context.textBaseline = "middle";
      yTicks.forEach(function (d) {
        context.fillText(d, -9, y0(d));
      });
      context.beginPath();
      context.moveTo(-6.5, 0 + 0.5);
      context.lineTo(0.5, 0 + 0.5);
      context.lineTo(0.5, height + 0.5);
      context.lineTo(-6.5, height + 0.5);
      context.strokeStyle = "black";
      context.stroke();
      context.fillStyle = "steelblue";
      data.forEach(function (d) {
        context.fillRect(x0(d.name), y0(d.value), x0.bandwidth(), height - y0(d.value));
      });
    }
    init();
  }());
</script>
</body>
</html>
二、多个x轴
示意图:

代码:
<!DOCTYPE html>
<html lang="en">
<head>
  <meta charset="UTF-8">
  <title></title>
</head>
<body>
<canvas id="myCanvas" width="600" height="400"></canvas>
<script src="d3.min.js"></script>
<script>
  "use strict";
  (function () {
    function init() {
      initData();
    }
    function initData() {var data =
        [
          {
            'name': '东北',
            'value': [
              {'name': '办公用品', 'value': 100},
              {'name': '家具', 'value': 20},
              {'name': '技术', 'value': 60}
            ]
          },
          {
            'name': '华北',
            'value': [
              {'name': '办公用品', 'value': 100},
              {'name': '家具', 'value': 80},
              {'name': '技术', 'value': 60}
            ]
          },
          {
            'name': '西南',
            'value': [
              {'name': '办公用品', 'value': 100},
              {'name': '家具', 'value': 80},
              {'name': '技术', 'value': 60}
            ]
          }
        ];
      initUI(data);
    }
    function initUI(data) {
      var canvas = document.querySelector('#myCanvas');
      var context = canvas.getContext('2d');
      var margin = {top: 20, right: 20, bottom: 45, left: 40};
      var width = canvas.width - margin.left - margin.right;
      var height = canvas.height - margin.top - margin.bottom;
      var xAxis0 = d3.scaleBand()
        .domain(data.map(function (d) {
          return d.name;
        }))
        .rangeRound([0, width]);
      var firstRow = data[0];
      var xAxis1 = d3.scaleBand()
        .domain(firstRow.value.map(function (d) {
          return d.name;
        }))
        .rangeRound([0, xAxis0.bandwidth()])
        .padding(0.5);
      var yAxis0 = d3.scaleLinear()
        .domain([0, d3.max(data, function (d0) {
          return d3.max(d0.value, function (d1) {
            return d1.value;
          })
        })])
        .range([height, 0]);
      context.translate(margin.left, margin.top);
      context.beginPath();
      context.textAlign = "center";
      context.textBaseline = "top";
      xAxis0.domain().forEach(function (d) {
        context.fillText(d, xAxis0(d) + xAxis0.bandwidth() / 2, height + 23);
      });
      data.forEach(function (d0) {
        var pX0 = xAxis0(d0.name);
        d0.value.forEach(function (d1) {
          context.moveTo(pX0 + xAxis1(d1.name) + xAxis1.bandwidth() / 2, height);
          context.lineTo(pX0 + xAxis1(d1.name) + xAxis1.bandwidth() / 2, height + 6);
          context.fillText(d1.name, pX0 + xAxis1(d1.name) + xAxis1.bandwidth() / 2, height + 6);
        });
      });
      context.strokeStyle = 'black';
      context.stroke();
      context.beginPath();
      context.moveTo(0.5, height + 0.5);
      context.lineTo(width + 0.5, height + 0.5);
      context.strokeStyle = "black";
      context.stroke();
      var yTickCount = 10;
      var yTicks = yAxis0.ticks(yTickCount);
      context.beginPath();
      yTicks.forEach(function (d) {
        context.moveTo(0, yAxis0(d) + 0.5);
        context.lineTo(-6, yAxis0(d) + 0 / 5);
      });
      context.strokeStyle = 'black';
      context.stroke();
      context.textAlign = "right";
      context.textBaseline = "middle";
      yTicks.forEach(function (d) {
        context.fillText(d, -9, yAxis0(d));
      });
      context.beginPath();
      context.moveTo(-6.5, 0 + 0.5);
      context.lineTo(0.5, 0 + 0.5);
      context.lineTo(0.5, height + 0.5);
      context.lineTo(-6.5, height + 0.5);
      context.strokeStyle = "black";
      context.stroke();
      context.fillStyle = "steelblue";
      data.forEach(function (d0) {
        var pX0 = xAxis0(d0.name);
        d0.value.forEach(function (d1) {
          var pX1 = pX0 + xAxis1(d1.name);
          var pY1 = yAxis0(d1.value);
          var pWidth = xAxis1.bandwidth();
          var pHeight = height - yAxis0(d1.value);
          context.fillRect(pX1, pY1, pWidth, pHeight);
        })
      });
    }
    init();
  }());
</script>
</body>
</html>
三、多个x、y轴
示意图:

代码:
<!DOCTYPE html>
<html lang="en">
<head>
  <meta charset="UTF-8">
  <title></title>
</head>
<body>
<canvas id="myCanvas" width="600" height="400"></canvas>
<script src="d3.min.js"></script>
<script>
  "use strict";
  (function () {
    function init() {
      initData();
    }
    function initData() {var data =
        [
          {
            'name': '利润',
            'value': [
              {
                'name': '东北',
                'value': [
                  {'name': '办公用品', 'value': 100},
                  {'name': '家具', 'value': 50},
                  {'name': '技术', 'value': 60}
                ]
              },
              {
                'name': '华北',
                'value': [
                  {'name': '办公用品', 'value': 90},
                  {'name': '家具', 'value': 70},
                  {'name': '技术', 'value': 60}
                ]
              },
              {
                'name': '西南',
                'value': [
                  {'name': '办公用品', 'value': 100},
                  {'name': '家具', 'value': 80},
                  {'name': '技术', 'value': 50}
                ]
              }
            ]
          },
          {
            'name': '销售额',
            'value': [
              {
                'name': '东北',
                'value': [
                  {'name': '办公用品', 'value': 100},
                  {'name': '家具', 'value': 20},
                  {'name': '技术', 'value': 60}
                ]
              },
              {
                'name': '华北',
                'value': [
                  {'name': '办公用品', 'value': 100},
                  {'name': '家具', 'value': 80},
                  {'name': '技术', 'value': 60}
                ]
              },
              {
                'name': '西南',
                'value': [
                  {'name': '办公用品', 'value': 100},
                  {'name': '家具', 'value': 80},
                  {'name': '技术', 'value': 60}
                ]
              }
            ]
          }
        ];
      initUI(data);
    }
    function initUI(data) {
      var canvas = document.querySelector('#myCanvas');
      var context = canvas.getContext('2d');
      var margin = {top: 20, right: 20, bottom: 45, left: 40};
      var width = canvas.width - margin.left - margin.right;
      var height = canvas.height - margin.top - margin.bottom;
      var firstRow = data[0].value;
      var firstFirstRow = firstRow[0].value;
      var xAxis0 = d3.scaleBand()
        .domain(firstRow.map(function (d) {
          return d.name;
        }))
        .rangeRound([0, width]);
      var xAxis1 = d3.scaleBand()
        .domain(firstFirstRow.map(function (d) {
          return d.name;
        }))
        .rangeRound([0, xAxis0.bandwidth()])
        .padding(0.5);
      var yAxis0 = d3.scaleBand()
        .domain(data.map(function (d) {
          return d.name;
        }))
        .range([height, 0])
        .paddingInner(0.1);
      var yAxis1 = d3.scaleLinear()
        .domain([0, d3.max(data, function (d0) {
          return d3.max(d0.value, function (d1) {
            return d3.max(d1.value, function (d2) {
              return d2.value;
            })
          })
        })])
        .range([yAxis0.bandwidth(), 0]);
      context.translate(margin.left, margin.top);
      context.beginPath();
      context.textAlign = "center";
      context.textBaseline = "top";
      xAxis0.domain().forEach(function (d) {
        context.fillText(d, xAxis0(d) + xAxis0.bandwidth() / 2, height + 23);
      });
      firstRow.forEach(function (xData0) {
        var pX0 = xAxis0(xData0.name);
        xData0.value.forEach(function (xData1) {
          context.moveTo(pX0 + xAxis1(xData1.name) + xAxis1.bandwidth() / 2, height);
          context.lineTo(pX0 + xAxis1(xData1.name) + xAxis1.bandwidth() / 2, height + 6);
          context.fillText(xData1.name, pX0 + xAxis1(xData1.name) + xAxis1.bandwidth() / 2, height + 6);
        })
      });
      context.strokeStyle = 'black';
      context.stroke();
      context.beginPath();
      data.forEach(function (yData0) {
        var pY0 = yAxis0(yData0.name);
        var y = +(pY0 + yAxis0.bandwidth()).toFixed(0) + 0.5;
        context.moveTo(0.5, y);
        context.lineTo(width + 0.5, y);
      });
      context.strokeStyle = "black";
      context.stroke();
      var yTickCount = 10;
      var yTicks = yAxis1.ticks(yTickCount);
      context.beginPath();
      data.forEach(function (yData0) {
        var pY0 = yAxis0(yData0.name);
        for (var idx = 0; idx < yData0.name.length; idx++) {
          context.fillText(yData0.name[idx], -30, pY0 + yAxis0.bandwidth() / 2 - 15 + idx * 15);
        }
        yTicks.forEach(function (d) {
          var y = +(pY0 + yAxis1(d)).toFixed(0) + 0.5;
          context.moveTo(0, y);
          context.lineTo(-6, y);
        });
      });
      context.strokeStyle = 'black';
      context.stroke();
      context.textAlign = "right";
      context.textBaseline = "middle";
      data.forEach(function (yData0) {
        var pY0 = yAxis0(yData0.name);
        yTicks.forEach(function (d) {
          var y = pY0 + yAxis1(d);
          context.fillText(d, -9, y);
        });
      });
      context.beginPath();
      context.moveTo(-6.5, 0 + 0.5);
      context.lineTo(0.5, 0 + 0.5);
      context.lineTo(0.5, height + 0.5);
      context.lineTo(-6.5, height + 0.5);
      context.strokeStyle = "black";
      context.stroke();
      context.fillStyle = "steelblue";
      data.forEach(function (yData0) {
        var pY0 = yAxis0(yData0.name);
        yData0.value.forEach(function (xData0) {
          var pX0 = xAxis0(xData0.name);
          xData0.value.forEach(function (xData1) {
            var pX1 = pX0 + xAxis1(xData1.name);
            var pY1 = pY0 + yAxis1(xData1.value);
            var pWidth = xAxis1.bandwidth();
            var pHeight = yAxis0.bandwidth() - yAxis1(xData1.value);
            context.fillRect(pX1, pY1, pWidth, pHeight);
          })
        })
      });
    }
    init();
  }());
</script>
</body>
</html>
源码下载:src


 浙公网安备 33010602011771号