图表 GRAPHS
示例集合:https://blogs.sap.com/2013/09/18/drawing-graphical-charts-with-abap/
1、可以使用事物代码 DWDM 查看图表的示例
http://www.sapfans.com/forums/viewtopic.php?t=2083
2、可以使用function : GFW_PRES_SHOW 进行编辑简单的图表
参考地址 :http://www.sapfans.com/forums/viewtopic.php?f=31&t=326609
实现两个图表在同一个容器中
*&---------------------------------------------------------------------*
*& Report ZTEST_ZT_5
*&---------------------------------------------------------------------*
*&
*&---------------------------------------------------------------------*
REPORT ZTEST_ZT_5.
*type pool declarations for graphical frame work

TYPE-POOLS: gfw.

*OK code declaration

DATA: ok_code TYPE sy-ucomm.

*structure declaration for graph 1 values

TYPES: BEGIN OF ty_gprval1.

       INCLUDE STRUCTURE gprval.

*     rowtxt(4) TYPE C,

*     val1(4) TYPE c,

*     val2(4) TYPE c,

TYPES : END OF ty_gprval1.


*structure declaration for graph 1 column names

TYPES: BEGIN OF ty_col1_texts.

*       coltxt(4) TYPE C,

       INCLUDE STRUCTURE gprtxt.

TYPES :END OF ty_col1_texts.


*data declarations for graph 1

DATA: grval1 TYPE STANDARD TABLE OF ty_gprval1,

      gprval1 TYPE ty_gprval1,

      col1_texts TYPE STANDARD TABLE OF ty_col1_texts,

      col1_wa TYPE ty_col1_texts.


*structure declaration for graph 2 values

TYPES: BEGIN OF ty_gprval2.

       INCLUDE STRUCTURE gprval.

*    rowtxt(10) TYPE C,

*    val1(4) TYPE c,

*    val2(4) TYPE c,

TYPES:END OF ty_gprval2.


*structure declaration for graph 2 column names

TYPES : BEGIN OF ty_col2_texts.

*        coltxt(40) TYPE C,

        INCLUDE STRUCTURE gprtxt.

TYPES : END OF ty_col2_texts.


*data declarations for graph2

DATA: grval2 TYPE STANDARD TABLE OF ty_gprval2,

      gprval2 TYPE ty_gprval2,

      col2_texts TYPE STANDARD TABLE OF ty_col2_texts,

      col2_wa TYPE ty_col2_texts.


*data declarations for containers,splitters,and custom container

DATA:custom_container TYPE REF TO cl_gui_custom_container,

     splitter TYPE REF TO cl_gui_splitter_container,

     cont1 TYPE REF TO cl_gui_container,

     cont2 TYPE REF TO cl_gui_container.


*Initialisation event

INITIALIZATION.


*start of selection event

START-OF-SELECTION.


*Call screen for the container for output

**Create a screen with custom control and name it as 'CONTAINER'(Here).

  CALL SCREEN 600.


*PBO module for the output display

*&----------------------------------------------------------------*

*&      Module  PBO_0600  OUTPUT

*&----------------------------------------------------------------*

MODULE pbo_0600 OUTPUT.

*Setting the GUI status for the splitter screen(EXIT button)

*  SET PF-STATUS 'SPLITGRAPH'.


*Setting the title for the splitter control

  SET TITLEBAR 'SPLITGRAPH'.


*Creating custom container

  CREATE OBJECT custom_container

    EXPORTING

      container_name = 'CONTAINER'.


*creating the splitter control

  CREATE OBJECT splitter

    EXPORTING

      parent  = custom_container

      rows    = 1

      columns = 2

      align   = 15.


*calling the container method of the splitter class

*for the first graphic

  CALL METHOD splitter->get_container

    EXPORTING

      row       = 1

      column    = 1

    RECEIVING

      container = cont1.


*calling the container method of the splitter class

*for the second graphic

  CALL METHOD splitter->get_container

    EXPORTING

      row       = 1

      column    = 2

    RECEIVING

      container = cont2.


**Graphic 1 display

  REFRESH : grval1,col1_texts.

  gprval1-rowtxt = 'Reports'.

  gprval1-val1 = 100.

  gprval1-val2 = 125.

  APPEND gprval1 TO grval1.

  gprval1-rowtxt = 'Tables'.

  gprval1-val1 = 200.

  gprval1-val2 = 600.

  APPEND gprval1 TO grval1.

  gprval1-rowtxt = 'Module-Pools'.

  gprval1-val1 = 135.

  gprval1-val2 = 150.

  APPEND gprval1 TO grval1.

  gprval1-rowtxt = 'Infotypes'.

  gprval1-val1 = 100.

  gprval1-val2 = 200.

  APPEND gprval1 TO grval1.

  col1_wa-coltxt = '2005'.

  APPEND col1_wa TO col1_texts.

  col1_wa-coltxt = '2006'.

  APPEND col1_wa TO col1_texts.


*Function module to display graph (Graph 1)

  CALL FUNCTION 'GFW_PRES_SHOW_MULT'

    EXPORTING

      parent            = cont1

      presentation_type = gfw_orient_rows

      show              = gfw_false

    TABLES

      values            = grval1

      column_texts      = col1_texts

    EXCEPTIONS

      error_occurred    = 1.


*Graphic 2 display

  REFRESH : grval2,col2_texts.

  gprval2-rowtxt = 'Dynamic actions'.

  gprval2-val1 = 3.

  gprval2-val2 = 5.

  APPEND gprval2 TO grval2.

  gprval2-rowtxt = 'TEM Reports'.

  gprval2-val1 = 27.

  gprval2-val2 = 30.

  APPEND gprval2 TO grval2.

  gprval2-rowtxt = 'Queries'.

  gprval2-val1 = 32.

  gprval2-val2 = 50.

  APPEND gprval2 TO grval2.

  gprval2-rowtxt = 'Others'.

  gprval2-val1 = 45.

  gprval2-val2 = 48.

  APPEND gprval2 TO grval2.

  col2_wa-coltxt = '2005'.

  APPEND col2_wa TO col2_texts.

  col2_wa-coltxt = '2006'.

  APPEND col2_wa TO col2_texts.


*Function module to display Graph 2

  CALL FUNCTION 'GFW_PRES_SHOW_MULT'

    EXPORTING

      parent            = cont2

      presentation_type = gfw_prestype_lines

      show              = gfw_true

    TABLES

      values            = grval2

      column_texts      = col2_texts

    EXCEPTIONS

      error_occurred    = 1.

ENDMODULE.                 " PBO_0600  OUTPUT


*PAI module : Based on user input,action is performed

*EXIT called to leave program when user clicks it

*&----------------------------------------------------------------*

*&      Module  PAI_0600  INPUT

*&----------------------------------------------------------------*

MODULE pai_0600.

  ok_code = sy-ucomm.

  IF ok_code EQ 'EXIT1'.

    LEAVE PROGRAM.

  ENDIF.

ENDMODULE.                 " PAI_0600  INPUT
效果图
3、可以使用SAP ALV自带的图表功能进行维护:
参考地址:https://blogs.sap.com/2014/07/07/alv-graphs-an-accidental-discovery/
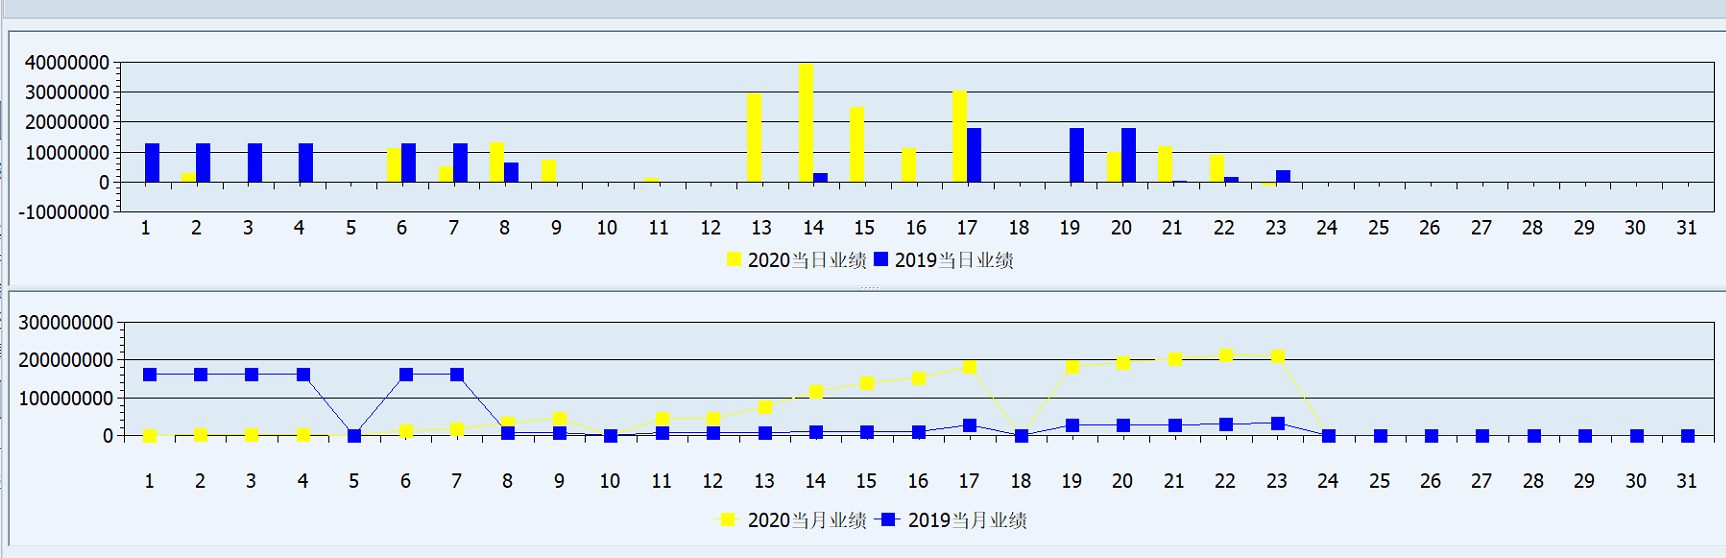
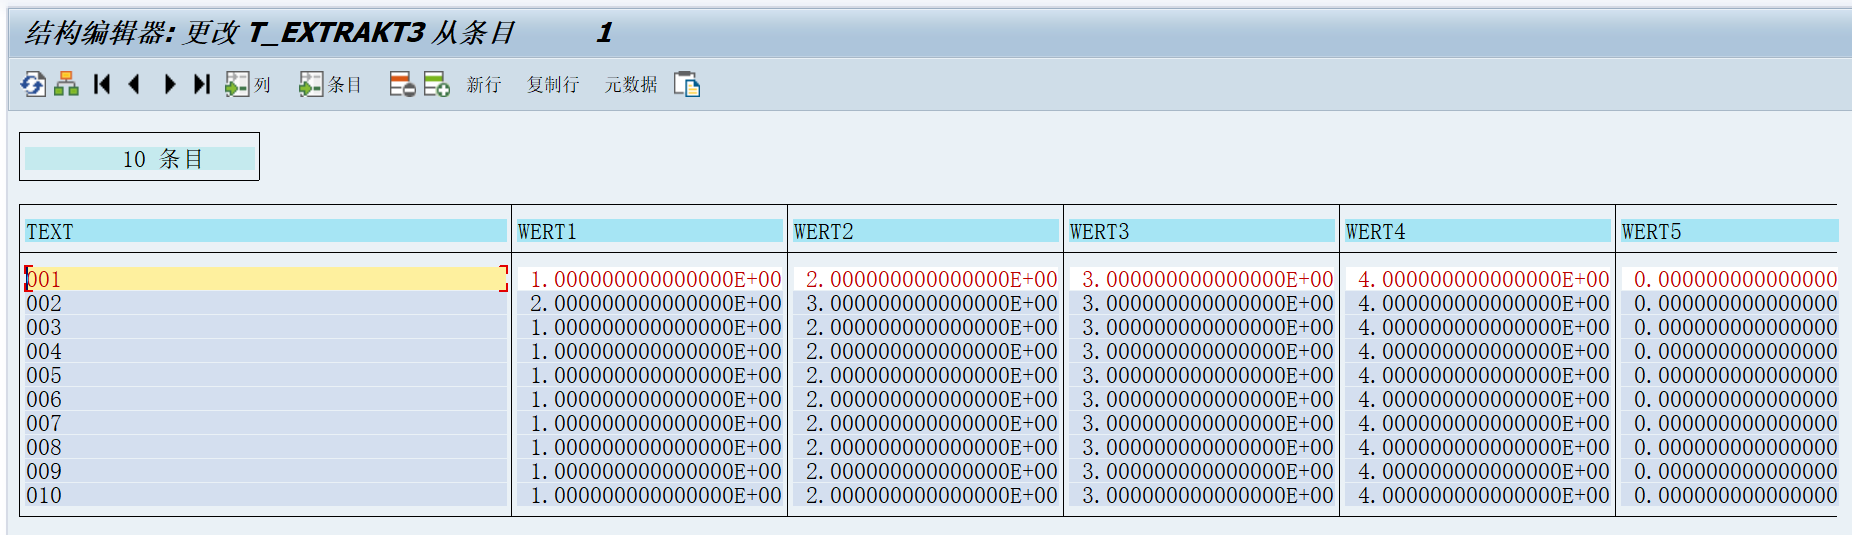
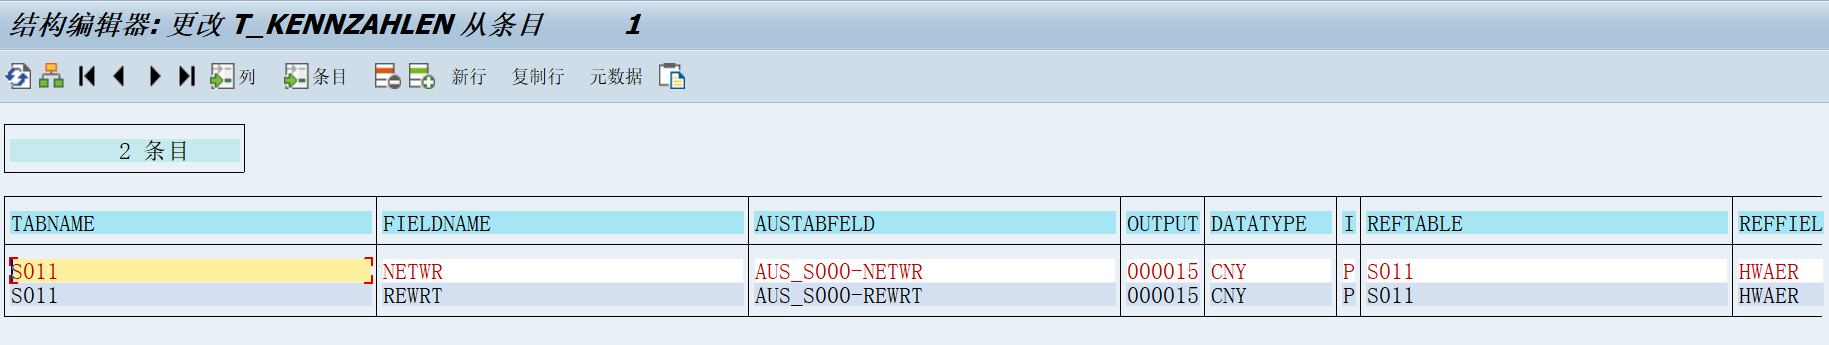
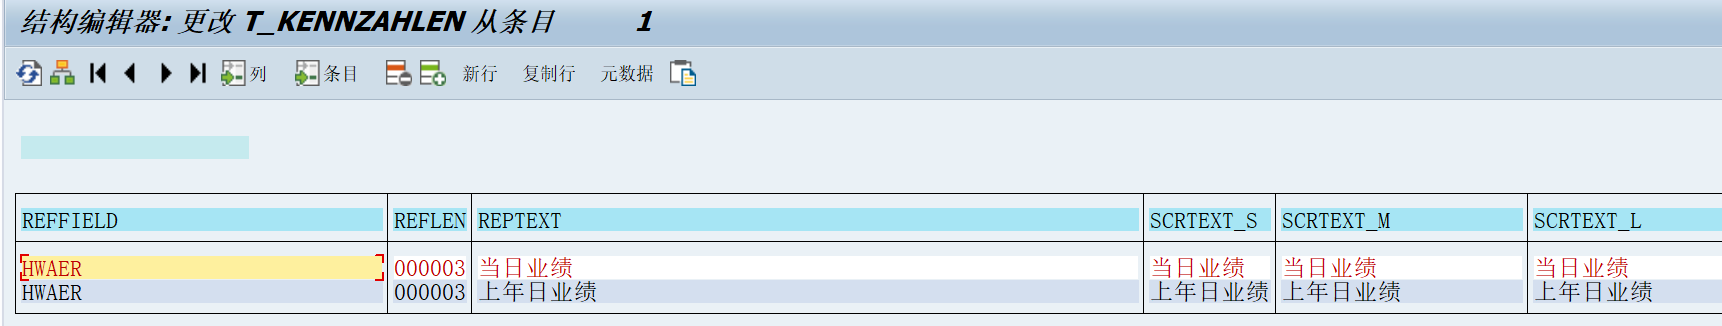
4、可以使用function : MCS_BUSG3_MENU 进行编辑复杂的3D图表
参数示例:


posted on 2020-02-20 22:56 TorranceZhao 阅读(344) 评论(0) 收藏 举报


 浙公网安备 33010602011771号