R语言学习笔记:因子
R语言中的因子就是factor,用来表示分类变量(categorical variables),这类变量不能用来计算而只能用来分类或者计数。
可以排序的因子称为有序因子(ordered factor)。
factor()
用来生成因子数据对象,语法是:
factor(data, levels, labels, ...)
其中data是数据,levels是因子的级别向量,labels是因子的标签向量。
以我的10个月的fitbit数据为例,创建一个因子
fitbit <- read.csv("fitbit.csv")
fitbit$date <- as.Date(fitbit$date)
month <- factor(format(fitbit$date,"%m")) #建立因子
这样就按月份建立一个因子,以后就可以按月份进行分类统计了。
str(month) #看看因子的结构信息,可以看到有10个级别Levels,代表着10个月份。
Factor w/ 10 levels "01","02","03",..: 1 1 1 1 1 1 1 1 1 1 ...
length(month) #向量的长度并不是10,而是fitbit中的数据行数。
[1] 304
summary(month) #可以看看汇总信息,这里列出每个分类中的数据个数
01 02 03 04 05 06 07 08 09 10
31 28 31 30 31 30 31 31 30 31
ordered()
也可以建立有序的因子:
ordered_month <- ordered(format(fitbit$date,"%m"))
str(ordered_month)
Ord.factor w/ 10 levels "01"<"02"<"03"<..: 1 1 1 1 1 1 1 1 1 1 ...
可以看出各个级别有顺序大小关系。
tapply()
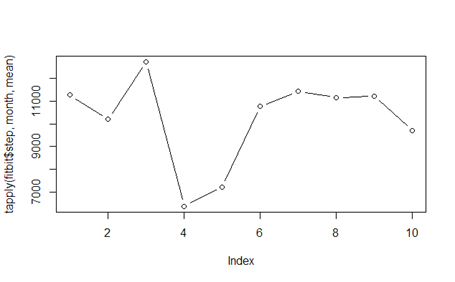
统计每个月的步数
tapply(fitbit$step, month, mean)
01 02 03 04 05 06 07 08 09 10
11263.032 10200.250 12710.065 6389.233 7228.774 10755.800 11425.903 11147.129 11210.767 9706.097
画出图来看看,4、5月份有缺失数据,所以平均数偏低
plot(tapply(fitbit$step, month, mean), type="b")
score1 <- ordered(score, levels = c('C', 'B', 'A')); score1
3、用cut()函数将一般的数据转换成因子或有序因子。
例1:exam <- c(98, 97, 52, 88, 85, 75, 97, 92, 77, 74, 70, 63, 97, 71, 98,
65, 79, 74, 58, 59, 60, 63, 87, 82, 95, 75, 79, 96, 50, 88)
exam1 <- cut(exam, breaks = 3) #切分成3组
exam2 <- cut(exam, breaks = c(0, 59, 69, 79, 89, 100)) #切分成自己设置的组
attr(exam1, 'levels'); attr(exam2, 'levels'); attr(exam2, 'class')
ordered(exam2, labels = c('bad', 'ok', 'average', 'good', 'excellent')) #一个有序因子
----==== Email: slofslb (GTD) qq.com 请将(GTD)换成@ ====----
版权声明:自由转载-非商用-非衍生-保持署名(创意共享3.0许可证)
作者:申龙斌的程序人生
---- 魔方、桥牌、象棋、游戏人生...
---- BASIC、C++、JAVA、C#、Haskell、Objective-C、Open Inventor、程序人生...
---- GTD伴我实现人生目标
---- 区块链生存训练
---- 用欧拉计划学Rust编程
---- 申龙斌的读书笔记(2011-2019)
----


 浙公网安备 33010602011771号