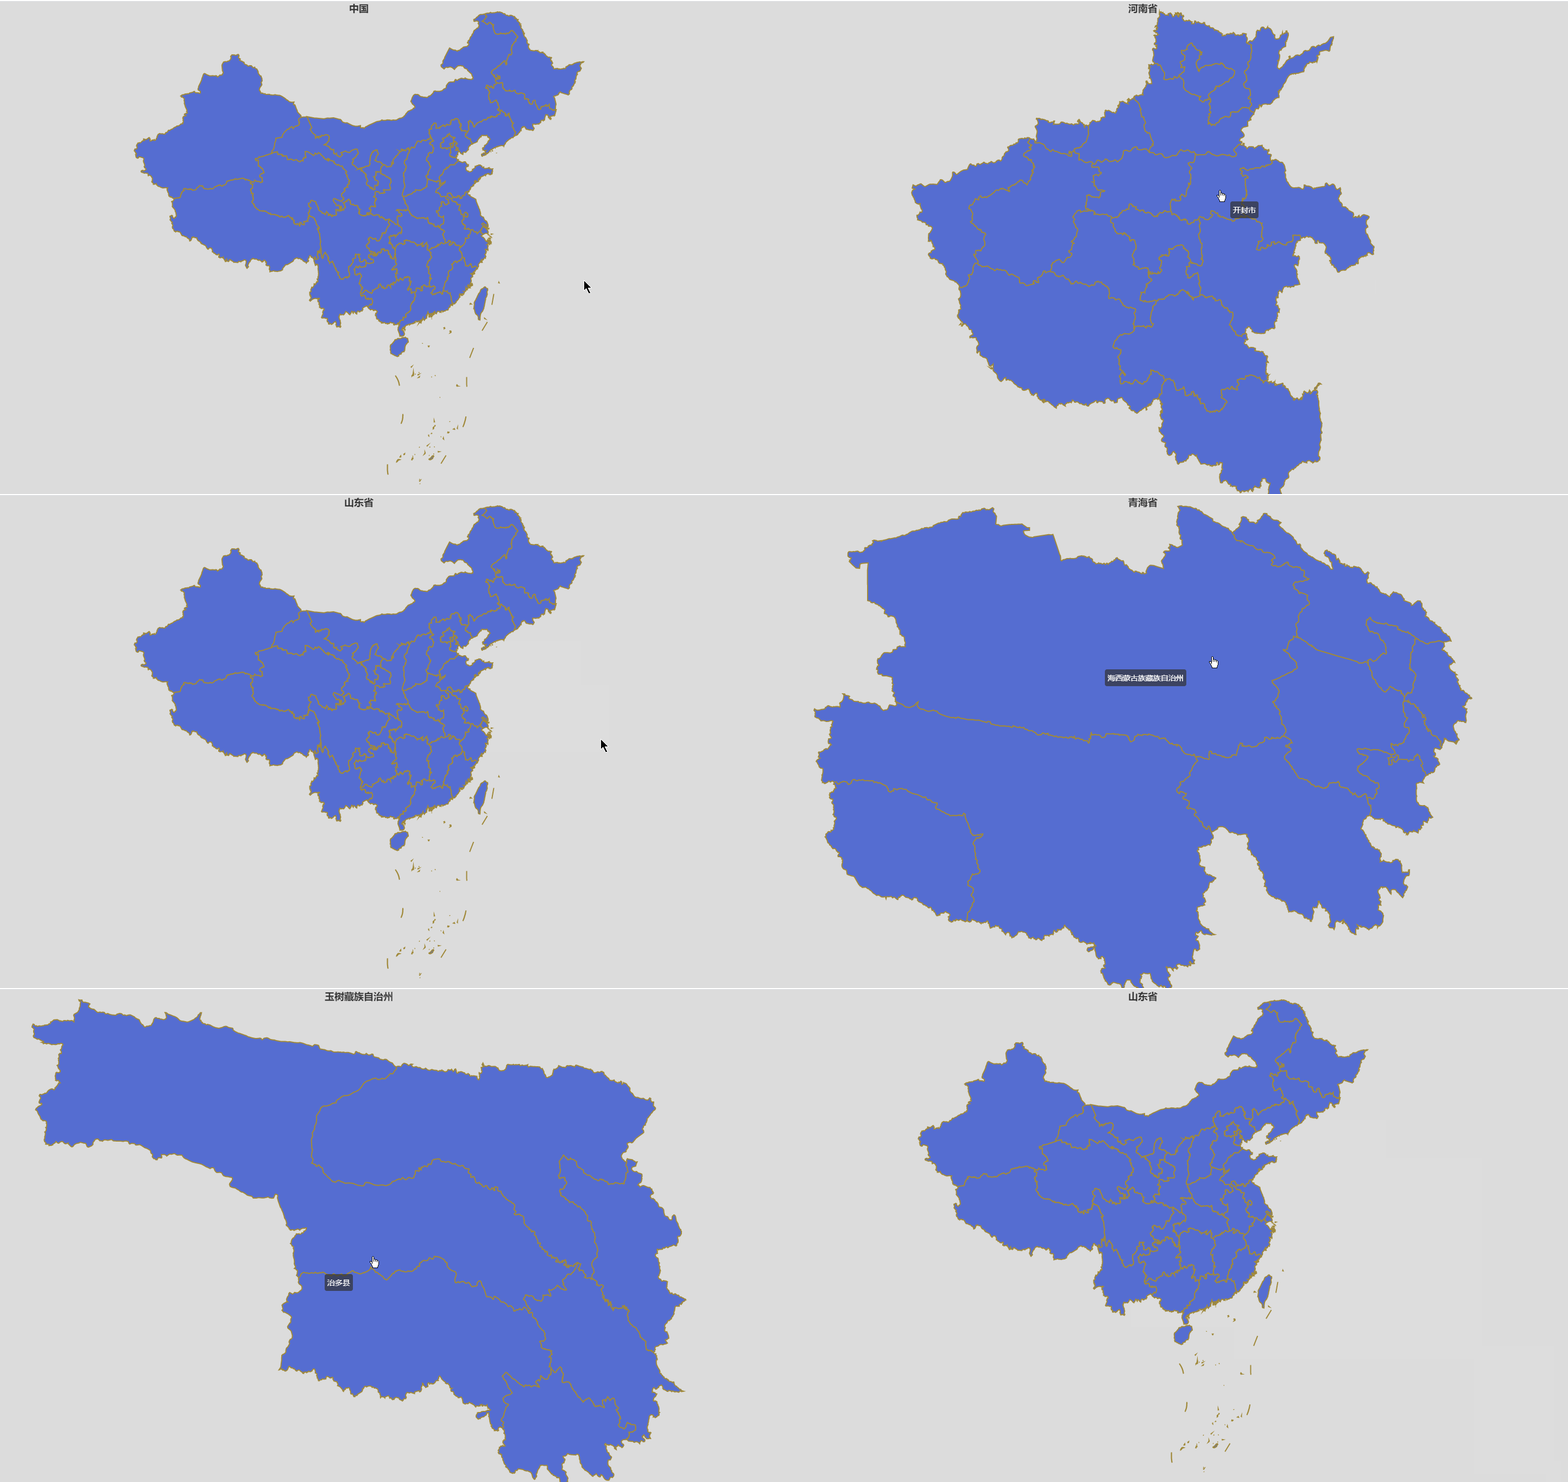
使用ehcarts实现地图下钻功能
你可以将下面的代码直接复制粘贴到本地查看运行效果
<!DOCTYPE html>
<html lang="en">

<head>
    <meta charset="UTF-8">
    <meta name="viewport" content="width=device-width, initial-scale=1.0">
    <title>地图下钻</title>
    <style>
        body{
            margin: 0 auto;
        }
        #main {
            position: fixed;
            left: 0;
            right: 0;
            top: 0;
            bottom: 0;
        }
    </style>
</head>

<body>
    <div id="main"></div>
    <script src="https://cdn.bootcdn.net/ajax/libs/jquery/3.5.1/jquery.min.js"></script>
    <script src="https://cdn.bootcdn.net/ajax/libs/echarts/4.7.0/echarts.min.js"></script>
    <script>
        let publicUrl = 'https://geo.datav.aliyun.com/areas_v2/bound/';

        async function initChart() {
            let chart = echarts.init(document.getElementById('main'));
            let alladcode = await getGeoJson('all.json')
            let chinaGeoJson = await getGeoJson('100000_full.json')
            initEcharts(chinaGeoJson, '中国', chart, alladcode)
        }
        initChart();

        //echarts绘图
        function initEcharts(geoJson, name, chart, alladcode) {
            echarts.registerMap(name, geoJson);
            let option = {
                title: {
                    text: name,
                    left: 'center',
                },
                tooltip: { //提示框组件
                    trigger: 'item',
                    showContent: true,
                    formatter: "{b}",
                },
                series: [{
                    type: 'map',
                    map: name,
                    zoom: 1.2, //这里是关键,一定要放在 series中
                    data: [{
                        name: "北京",
                        value: 200,
                    }],
                    label: {
                        normal: {
                            show: false,
                            // 设置字体颜色
                            color: '#ad2091',
                            // 设置字体大小
                            fontSize: 12,
                            fontWeight: 700,
                            formatter: (event) => {
                                return `${event.name}\n${event.value || ''}`
                            },
                        },
                    },
                    itemStyle: {
                        normal: {
                            // 设置地图默认的背景颜色
                            areaColor: '#556dd1',
                            // 设置地图边框颜色
                            borderColor: '#a18a3a',
                            // 设置地图边框宽度
                            borderWidth: 2
                        }
                    },
                    // 鼠标悬浮到地图上的label
                    emphasis: {
                        itemStyle: {
                            // 高亮时点的颜色。
                            color: 'blue',
                            areaColor: '#91c7ae',
                        },
                        label: {
                            show: true,
                            // 高亮时标签的文字。
                            color: "#ddd"
                        }
                    }
                }],
                // 设置地图背景色
                backgroundColor: '#ddd',
            }
            // 设置数据
            chart.setOption(option)
            // 解绑click事件
            chart.off("click");
            //给地图添加监听事件
            chart.on('click', async params => {
                // 获取当前点击的地图code
                let clickRegion = alladcode.find(areaJson => areaJson.name === params.name);
                // 获取要获取地图的json名称
                let regionJsonName = clickRegion.adcode + '_full.json'
                // 获取点击的区域名称
                let cityName = params.name
                // 判断当前点击的地图等级,如果是区级,则再次点击时重新回到全国的数据
                if (clickRegion.level === 'district') {
                    regionJsonName = '100000_full.json'
                    cityName = '山东省'
                }
                // 根据地图code获取
                getGeoJson(regionJsonName).then((result) => {
                    initEcharts(result, cityName, chart, alladcode)
                })
            })
        }
        //获取地图json数据
        async function getGeoJson(jsonName) {
            return await $.get(publicUrl + jsonName)
        }
    </script>
</body>

</html>
动画演示


