

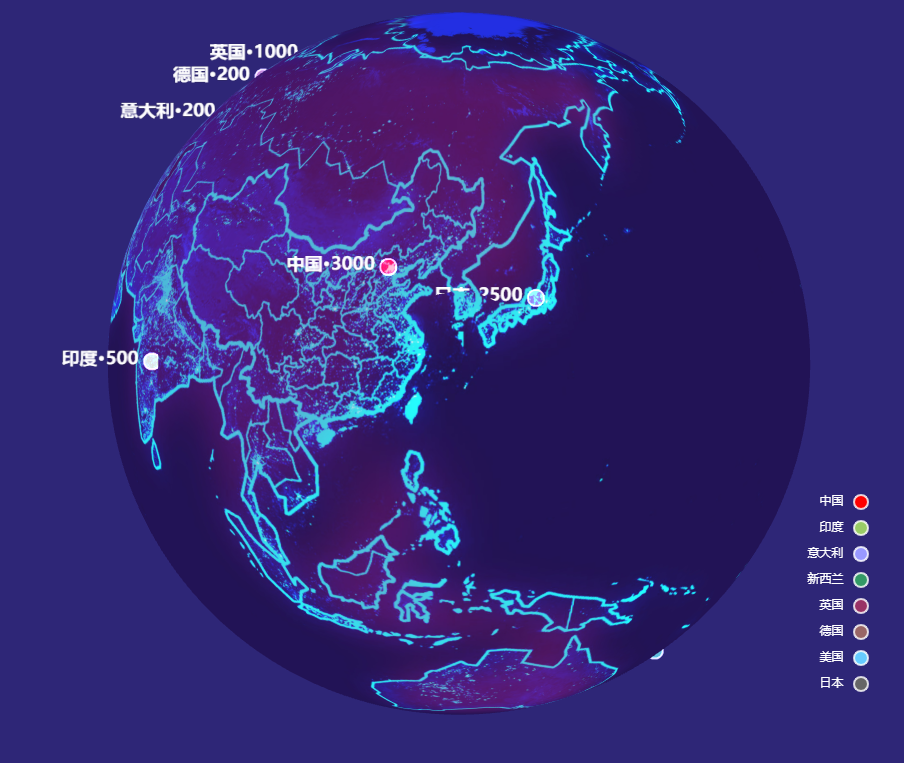
使用Echarts实现3D地球效果

<html style="height: 100%">

<head>
    <meta charset="utf-8">
    <meta charset="utf-8">
    <meta name="viewport" content="width=device-width,initial-scale=1.0,maximum-scale=1.0,user-scalable=0">
    <style type="text/css">
        html,
        body {
            margin: 0;
            padding: 0;
            height: 100%;
            box-sizing: border-box;
        }

        #container {
            width: 100%;
            height: 100%;
        }
    </style>
</head>

<body>
    <div id="container"></div>
</body>

<script src="./js/echarts.min.js"></script>
<script src="./js/echarts-gl.min.js"></script>
<script type="text/javascript">
    // 获取元素
    let dom = document.getElementById("container");
    // 初始化echarts
    let myChart = echarts.init(dom);
    // 地球数据显示
    let ds = [{
        name: '中国',
        point: [116.46, 39.92, 0],
        itemStyleColor: '#f00',
        labelText: '中国•3000'
    }, {
        name: '印度',
        point: [78.96288, 20.593684, 0],
        itemStyleColor: '#99CC66',
        labelText: '印度•500'
    }, {
        name: '意大利',
        point: [12.56738, 41.87194, 0],
        itemStyleColor: '#9999FF',
        labelText: '意大利•200'
    }, {
        name: '新西兰',
        point: [174.885971, -40.900557, 0],
        itemStyleColor: '#339966',
        labelText: '新西兰•10'
    }, {
        name: '英国',
        point: [-3.435973, 55.378051, 0],
        itemStyleColor: '#993366',
        labelText: '英国•1000'
    }, {
        name: '德国',
        point: [10.451526, 51.165691, 0],
        itemStyleColor: '#996666',
        labelText: '德国•200'
    }, {
        name: '美国',
        point: [-95.712891, 37.09024, 0],
        itemStyleColor: '#66CCFF',
        labelText: '美国•2200'
    }, {
        name: '日本',
        point: [138.252924, 36.204824, 0],
        itemStyleColor: '#666666',
        labelText: '日本•2500'
    }]

    // 点配置信息
    let series = ds.map(item => {
        return {
            name: item.name, // 是否显示左上角图例
            type: 'scatter3D',
            coordinateSystem: 'globe',
            blendMode: 'lighter',
            symbolSize: 16, // 点位大小

            itemStyle: {
                color: item.itemStyleColor, // 各个点位的颜色设置
                opacity: 1, // 透明度
                borderWidth: 1, // 边框宽度
                borderColor: 'rgba(255,255,255,0.8)' //rgba(180, 31, 107, 0.8)
            },
            label: {
                show: true, // 是否显示字体
                position: 'left', // 字体位置。top、left、right、bottom
                formatter: item.labelText, // 具体显示的值
                textStyle: {
                    color: '#fff', // 字体颜色
                    borderWidth: 0, // 字体边框宽度
                    borderColor: '#fff', // 字体边框颜色
                    fontFamily: 'sans-serif', // 字体格式
                    fontSize: 18, // 字体大小
                    fontWeight: 700 // 字体加粗
                }
            },
            data: [item.point] // 数据来源
        }
    })

    // 添加上面的配置项到地球上
    myChart.setOption({
        // 图例设置
        legend: {
            selectedMode: 'multiple',
            x: 'right',
            y: 'bottom',
            data: ds.map(item => {
                return item.name // 数据来源
            }),
            padding: [0, 550, 140, 0], // 填充位置,上、右、下、左
            orient: 'vertical', // 排列方式,vertical:垂直排列
            textStyle: {
                color: '#fff', // 文字颜色
            }
        },
        // 地球背景色
        backgroundColor: '#2E2677',
        // 地球参数设置
        globe: {
            baseTexture: './image/bg4.jpg', // 地球表面覆盖的图片,可以替换成自己想要的图片
            shading: 'color', // 地球中三维图形的着色效果
            viewControl: {
                autoRotate: true, // 是否开启视角绕物体的自动旋转查看
                autoRotateSpeed: 3, //物体自转的速度,单位为角度 / 秒,默认为10 ,也就是36秒转一圈。
                autoRotateAfterStill: 2, // 在鼠标静止操作后恢复自动旋转的时间间隔,默认 3s
                rotateSensitivity: 2, // 旋转操作的灵敏度,值越大越灵敏.设置为0后无法旋转。[1, 0]只能横向旋转.[0, 1]只能纵向旋转
                targetCoord: [116.46, 39.92], // 定位到北京
                maxDistance: 200,
                minDistance: 200
            }
        },
        // 地球文字显示信息配置
        series: series
    })
</script>

</html>
代码中引入的js和图片可以从我的码云中获取,源码地址:https://gitee.com/szxio/echarts-realize-3-d-earth
静态效果图
动态效果图


【推荐】国内首个AI IDE,深度理解中文开发场景,立即下载体验Trae
【推荐】编程新体验,更懂你的AI,立即体验豆包MarsCode编程助手
【推荐】抖音旗下AI助手豆包,你的智能百科全书,全免费不限次数
【推荐】轻量又高性能的 SSH 工具 IShell:AI 加持,快人一步
· 开发者必知的日志记录最佳实践
· SQL Server 2025 AI相关能力初探
· Linux系列:如何用 C#调用 C方法造成内存泄露
· AI与.NET技术实操系列(二):开始使用ML.NET
· 记一次.NET内存居高不下排查解决与启示
· 阿里最新开源QwQ-32B,效果媲美deepseek-r1满血版,部署成本又又又降低了!
· 开源Multi-agent AI智能体框架aevatar.ai,欢迎大家贡献代码
· Manus重磅发布:全球首款通用AI代理技术深度解析与实战指南
· 被坑几百块钱后,我竟然真的恢复了删除的微信聊天记录!
· AI技术革命,工作效率10个最佳AI工具