
CeontOS 7.x ELK部署
系统环境
node1 kibana-6.3.2
node2 elasticsearch-6.3.2
node3 elasticsearch-6.3.2
node4 logstash-6.3.2
说明:将所有软件安装至/data目录下,并创建app用户运行服务。
1、elasticsearch安装前准备(node1、node2)
elasticsearch安装服务器调优
vim /etc/security/limits.conf

* hard nofile 65536
* soft nofile 65536

* soft nproc 2048
* hard nproc 4096

vim /etc/sysctl.conf

vm.max_map_count=262144

sysctl -p
2、解压elasticsearch-6.3.2
cd /data/;tar xf elasticsearch-6.3.2.tar.gz ;mv elasticsearch-6.3.2 es
3、es-6.3.2配置文件(node2只需修改“node.name”参数)
vim /data/es/config/elasticsearch.yml
cluster.name: my-elk-cluster
node.name: node1
path.data: /data/es/data
path.logs: /data/es/logs/
bootstrap.memory_lock: false
network.host: 0.0.0.0
http.port: 9200
transport.tcp.port: 9300
transport.tcp.compress: true
discovery.zen.ping.unicast.hosts: ["node1", "node2"]
es-7.2.0配置
cluster.name: my-elk-cluster
node.name: node2
path.data: /data/es/data
path.logs: /data/es/logs/
bootstrap.memory_lock: false
network.host: 0.0.0.0
http.port: 9200
#discovery.zen.ping.unicast.hosts: ["node1", "node2"]
discovery.seed_hosts: ["node1", "node2"]
cluster.initial_master_nodes: ["node1", "node2"]
增强版
# 集群名称
cluster.name: my-elk-cluster

# 该节点名称,与前面配置hosts保持一致
node.name: node1

# 数据
path.data: /data/es/data

# 日志
path.logs: /data/es/logs/

# 指定该节点是否有资格被选举成为主节点
node.master: true

# 指定该节点是否存储索引数据,默认为true
node.data: true


bootstrap.memory_lock: false
# 监听全部ip,在实际环境中应为一个安全的ip
network.host: 0.0.0.0

# es服务的端口号
http.port: 9200

# es集群通信端口号
transport.tcp.port: 9300

transport.tcp.compress: true

# 配置自动发现
discovery.seed_hosts: ["node1:9300", "node2:9300"]

# 主节点 一般配置为(n/2+1)
cluster.initial_master_nodes: ["node1"]
4、node1、node2启动es服务
/data/es/bin/elasticsearch -d
查看节点信息:http://192.168.0.172:9200/
查看群集的健康状态:http://192.168.0.172:9200/_cluster/health?pretty
查看群集的状态信息:http://192.168.0.172:9200/_cluster/state?pretty
此方式查看集群状态不友好,可安装Elasticsearch-head插件更方便的管理集群
在node1安装Elasticsearch-head插件(需要提前安装node和phantomjs):
nodejs安装(下载需要的版本进行安装)
V12.x:#curl --silent --location https://rpm.nodesource.com/setup_12.x | bash -

V8.x:#curl --silent --location https://rpm.nodesource.com/setup_8.x | bash -

V7.x:#curl --silent --location https://rpm.nodesource.com/setup_7.x | bash -

V6.x:#curl --silent --location https://rpm.nodesource.com/setup_6.x | bash -

V5.x:#curl --silent --location https://rpm.nodesource.com/setup_5.x | bash -

yum install -y nodejs

node -v
phantomjs安装(官网下载http://phantomjs.org/download.html)
tar jxf phantomjs-2.1.1-linux-x86_64.tar.bz2
cd phantomjs-2.1.1-linux-x86_64/bin
cp -a phantomjs /usr/local/bin/
Elasticsearch-head安装(https://github.com/mobz/elasticsearch-head)
unzip elasticsearch-head-master.zip
cd elasticsearch-head-master
npm install
vim /etc/elasticsearch/elasticsearch.yml

#编辑主配置文件,在任意位置添加如下两行:
http.cors.enabled: true                #添加该行,开启跨域访问支持
http.cors.allow-origin: "*"             #添加该行,跨域访问允许的域名地址
#重启es

启动插件
npm run start &
kibana-6.3.2配置文件
server.port: 5601
server.host: "0.0.0.0"
elasticsearch.url: "http://192.168.0.172:9200"
kibana.index: ".kibana"
kibana-7.2.0配置文件
server.port: 5601
server.host: "0.0.0.0"
#elasticsearch.url: "http://192.168.0.172:9200"
elasticsearch.hosts: ["http://192.168.0.172:9200"]
kibana.index: ".kibana"
i18n.locale: "zh-CN"
启动
nohup /data/kibana-7.6.1/bin/kibana &
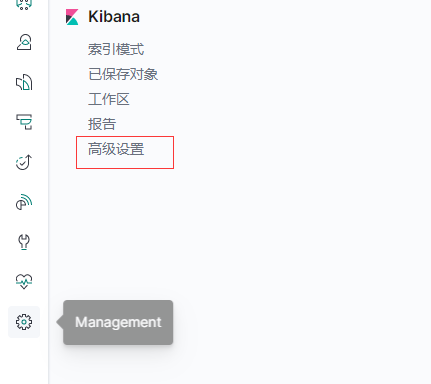
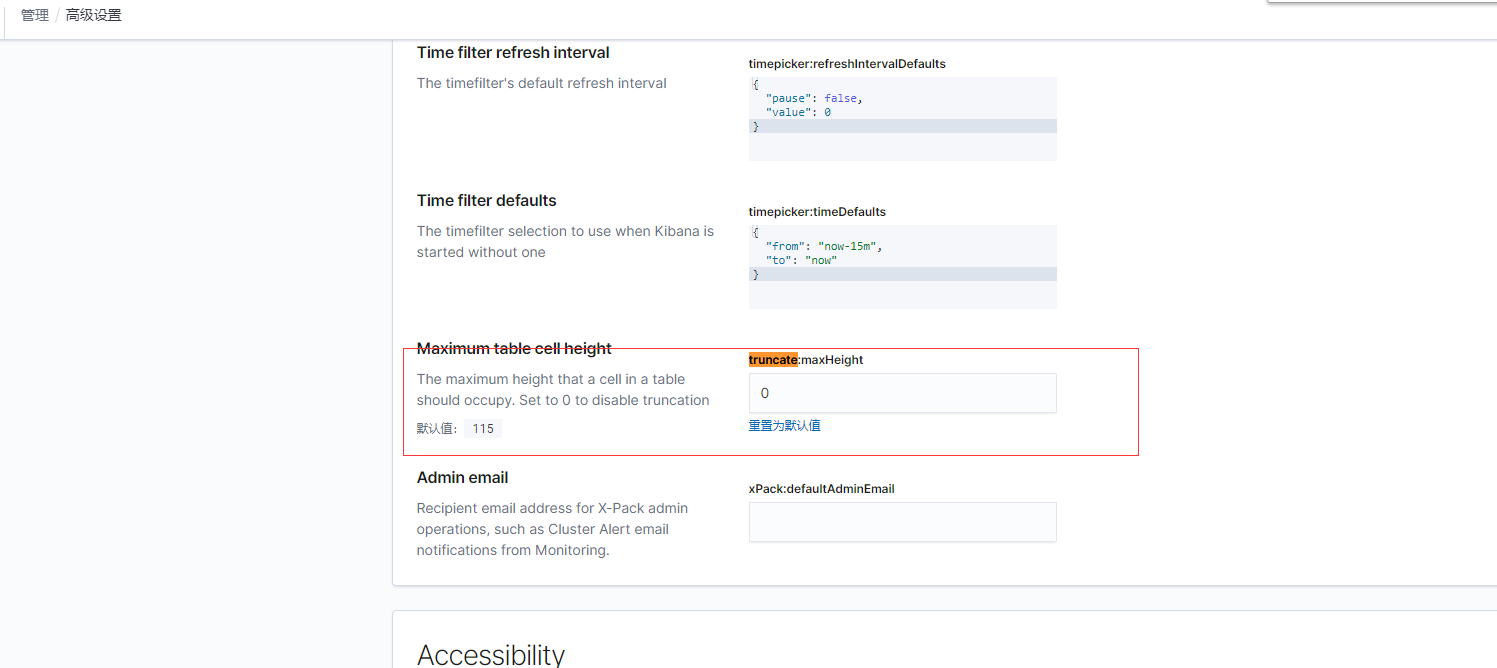
如果发现kibana中message数据显示不全在kibana的management=>advance setting里设置truncate:maxHeight为0
logstash配置(接手filebeat发送过来的日志)
config/pro.conf
input {
  beats {
    port => 5044
    codec => json
  }
}

filter {

}

output {
    #if [message] =~ "ERROR" {
    #错误日志钉钉报警
    if "ERROR" in [message] {
        http {
            url => "https://oapi.dingtalk.com/robot/send?axxxxxxxxx356ab336xxxxxxf642bbe99a35d30021514ec1"
            http_method => "post"
            #content_type => "pplication/json; charset=utf-8"
            mapping => {
                "msgtype" => "text"
                "text" => "{'content':'######%{[fields][service]}######\n%{message}\n########%{[fields][service]}########'}"
            }
        }

    }

    elasticsearch {
        hosts => ["http://192.168.0.172:9200"]
        index => "%{[fields][service]}-%{+YYYY-MM-dd}"
        #index => "%{fields.service}-%{+YYYY.MM.dd}"
        #user => "elastic"
        #password => "changeme"
    }
}
启动
nohup bin/logstash -f config/pro.conf &
filebeat配置
filebeat.inputs:

- type: log
  enabled: false
  paths:
    - /var/log/*.log

- type: log
  enabled: true
#日志路径
  paths:
    - /data/log/access.log
#日志tags
  tags: ["access"]
#排除空行
  exclude_lines: ['^$']
#java多行日志合并
  multiline:
    pattern: '^\[[0-9]{2}-[0-9]{2}'
    negate: true
    match: after
logstash中设置的index => "%{[fields][service]}-%{+YYYY-MM-dd}"
  fields:
    service: access


filebeat.config.modules:
  path: ${path.config}/modules.d/*.yml

  reload.enabled: false


setup.template.settings:
  index.number_of_shards: 1


output.logstash:
  hosts: ["172.18.6.193:5055"]
错误日志(日志中如果有"error"关键字的日志,进行多行合并,发送至kafka.)
filebeat.prospectors:
- input_type: log
  paths:
    - /tmp/test.log
  include_lines: ['error']
  multiline:
        pattern: '^\['
        negate:  true
        match:   after
output.kafka:
  enabled: true
  hosts: ["192.168.12.105:9092"]
  topic: logstash-errors-log
启动
nohup ./filebeat -e -c filebeat.yml &

 浙公网安备 33010602011771号