
Enabling Chrome Developer Tools inside Postman
Chrome's Developer Tools are an indispensable part of the modern web development workflow. However, accessing them inside the Postman packaged app takes a few steps. To enable them:
Type chrome://flags inside your Chrome URL window
Search for "packed" or try to find the "Enable debugging for packed apps" setting
Enable the setting
Restart Chrome
chrome___flags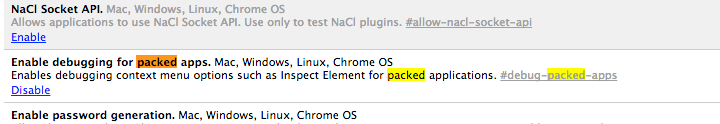
You can access the Developer Tools window by right clicking anywhere inside Postman and selecting "inspect element".
You can also go to chrome://inspect/#apps and then click "inspect" just below requester.html under the Postman heading.
Once enabled, you can use the Network Tools tab for even more information on your requests or the console while writing test scripts. If something goes wrong with your test scripts, it'll show up here.
Developer Tools inside Chrome are really powerful and now with the ability to write test scripts inside Postman, you can use them for debugging and logging.
For more information on Chrome Developer Tools, check out these tutorials.
http://blog.getpostman.com/2014/01/27/enabling-chrome-developer-tools-inside-postman/

 浙公网安备 33010602011771号