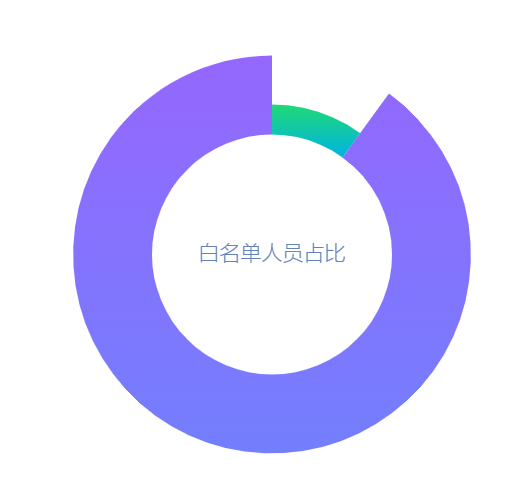
echarts常见柱状图,折线图,饼图,环状图,不断更新中
option = {
tooltip: {
show:false
},
legend: {
x: "center",
y: "bottom",
data: ["rose3", "rose5", "rose6", "rose7", "rose8"],
},
calculable: true,
xAxis: {
max: 10,
show: false,
splitLine: {
show: false,
},
},
yAxis: {
max: 10,
show: false,
splitLine: {
show: false,
},
},
title: {
text: '白名单人员占比',
left: "center",
top: "center",
textStyle: {
color: "#6482BD",
fontSize: 14,
align: "center",
fontWeight: 100
},
},
series: [
{
type: "pie",
radius: [80, 120],
center: ["50%", "50%"],
labelLine:{
show:false
},
data: [
{
value: 10,
itemStyle: {
color: "transparent",
},
},
{
value: 90,
name: "rose2",
itemStyle: {
color: {
type: 'linear',
x: 0,
y: 0,
x2: 0,
y2: 1,
colorStops: [{
offset: 0, color: "#9567fd", // 0% 处的颜色
}, {
offset: 1, color: "#737ffd", // 100% 处的颜色
}],
global: false
}
},
labelLine: {
show: false,
length: 200,
length2: 100,
},
},
],
},
{
type: "pie",
radius: [80, 100],
center: ["50%", "50%"],
labelLine:{
show: false
},
data: [
{
value: 10,
itemStyle: {
color: {
type: 'linear',
x: 0,
y: 0,
x2: 0,
y2: 1,
colorStops: [{
offset: 0, color: "#20d975", // 0% 处的颜色
}, {
offset: 1, color: "#00b3e3", // 100% 处的颜色
}],
global: false
}
},
labelLine: {
show: false,
},
},
{
value: 90,
itemStyle: {
color: "transparent",
},
},
],
},
],
};


【推荐】国内首个AI IDE,深度理解中文开发场景,立即下载体验Trae
【推荐】编程新体验,更懂你的AI,立即体验豆包MarsCode编程助手
【推荐】抖音旗下AI助手豆包,你的智能百科全书,全免费不限次数
【推荐】轻量又高性能的 SSH 工具 IShell:AI 加持,快人一步
· Manus爆火,是硬核还是营销?
· 终于写完轮子一部分:tcp代理 了,记录一下
· 别再用vector<bool>了!Google高级工程师:这可能是STL最大的设计失误
· 震惊!C++程序真的从main开始吗?99%的程序员都答错了
· 单元测试从入门到精通
2016-10-31 dedeCMS修改文章更新发布时间问题