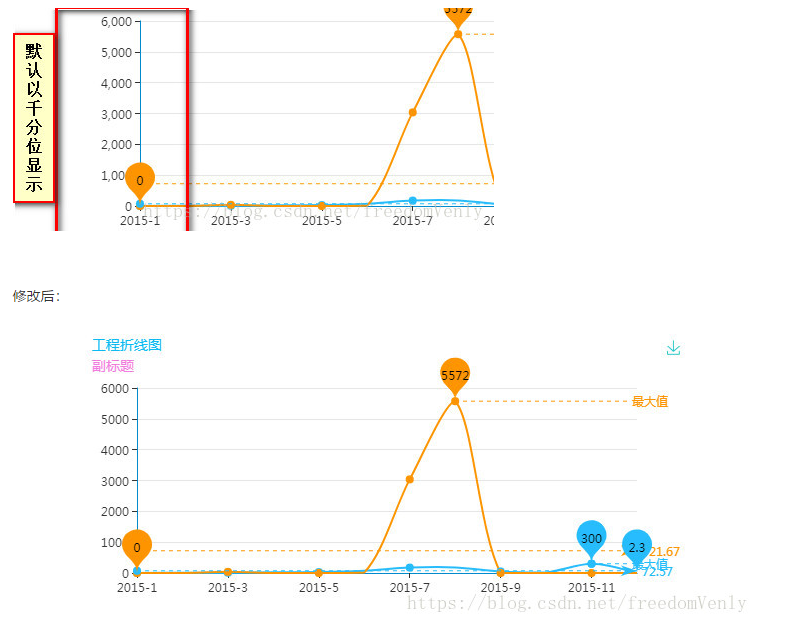
EChart 标题 title 样式,x轴、y轴坐标显示,调整图表位置等
EChart 标题 title 样式,x轴、y轴坐标显示,调整图表位置等
示例里工作一般情况是够用了,更复杂的可以查询教程:
title 官方解说:http://echarts.baidu.com/option.html#title
坐标相关: X轴:http://echarts.baidu.com/option.html#xAxis
坐标相关: Y轴:http://echarts.baidu.com/option.html#yAxis
表格部分:http://echarts.baidu.com/option.html#grid
1 2 3 4 5 6 7 8 9 10 11 12 13 14 15 16 17 18 19 20 21 22 23 24 25 26 27 28 29 30 31 32 33 34 35 36 37 38 39 40 41 42 43 44 45 46 47 48 49 50 51 52 53 54 55 56 57 58 59 60 61 62 63 64 65 66 67 68 69 70 71 72 73 74 75 76 77 78 79 80 81 82 83 84 85 86 87 88 89 90 91 92 93 94 95 96 97 98 99 100 101 102 103 104 105 106 107 108 109 110 111 112 113 114 115 116 117 118 119 120 121 122 123 124 125 126 127 128 129 130 | <script> function getChartsLine() { var myChart = echarts.init(document.getElementById('progress'),'macarons'); var option = { title: { text: '工程折线图', //主标题 textStyle:{ color:'#0DB9F2', //颜色 fontStyle:'normal', //风格 fontWeight:'normal', //粗细 fontFamily:'Microsoft yahei', //字体 fontSize:14, //大小 align:'center' //水平对齐 }, subtext:'副标题', //副标题 subtextStyle:{ //对应样式 color:'#F27CDE', fontSize:14 }, itemGap:7 }, grid:{ //显示数据的图表位于当前canvas的坐标轴 x:50, y:55, x2:50, y2:60, borderWidth:1 }, tooltip: { trigger: 'axis' }, legend: { data:["计划完成","实际完成"] }, toolbox: { show: true, feature: { saveAsImage: {} } }, xAxis: { type: 'category', boundaryGap: false, data: ["2015-1", "2015-2", "2015-3", "2015-4", "2015-5", "2015-6", "2015-7", "2015-8", "2015-9", "2015-10", "2015-11", "2015-12"] }, yAxis: { type: 'value', //默认以千分位显示,不想用的可以在这加一段 axisLabel : { //调整左侧Y轴刻度, 直接按对应数据显示 show:true, showMinLabel:true, showMaxLabel:true, formatter: function (value) { return value; } } }, series: [ { name:"计划", type:'line', data: [2.6, 5.9, 9.0, 26.4, 28.7, 70.7, 175.6, 182.2, 48.7, 18.8, 300, 2.3], markPoint: { data: [ {type: 'max', name: '最大值'}, {type: 'min', name: '最小值'} ] }, markLine: { data: [ {type: 'average', name: '平均值'}, [{ symbol: 'none', x: '90%', yAxis: 'max' }, { symbol: 'circle', label: { normal: { position: 'start', formatter: '最大值' } }, type: 'max', name: '最高点' }] ] } }, { name:"实际", type:'line', data:[0, 0, 37, 0, 0, 15, 3036, 5572, 0, 0, 0, 0], markPoint: { data: [ {type: 'max', name: '最大值'}, {type: 'min', name: '最小值'} ] }, markLine: { data: [ {type: 'average', name: '平均值'}, [{ symbol: 'none', x: '90%', yAxis: 'max' }, { symbol: 'circle', label: { normal: { position: 'start', formatter: '最大值' } }, type: 'max', name: '最高点' }] ] } } ] }; myChart.setOption(option); } getChartsLine();</script> |

转载的别人的


【推荐】编程新体验,更懂你的AI,立即体验豆包MarsCode编程助手
【推荐】凌霞软件回馈社区,博客园 & 1Panel & Halo 联合会员上线
【推荐】抖音旗下AI助手豆包,你的智能百科全书,全免费不限次数
【推荐】轻量又高性能的 SSH 工具 IShell:AI 加持,快人一步