
机器学习聚类算法之DBSCAN
一、概念
DBSCAN是一种基于密度的聚类算法,DBSCAN需要两个参数,一个是以P为中心的邻域半径;另一个是以P为中心的邻域内的最低门限点的数量,即密度。
优点:
1、不需要提前设定分类簇数量,分类结果更合理;
2、可以有效的过滤干扰。
缺点:
1、对高维数据处理效果较差;
2、算法复杂度较高,资源消耗大于K-means。
二、计算
1、默认使用第一个点作为初始中心;
2、通过计算点到中心的欧氏距离和领域半径对比,小于则是邻域点;
3、计算完所有点,统计邻域内点数量,小于于最低门限点数量则为噪声;
4、循环统计各个点的邻域点数,只要一直大于最低门限点数量,则一直向外扩展,直到不再大于。
5、一个簇扩展完成,会从剩下的点中重复上述操作,直到所有点都被遍历。
三、实现
#!/usr/bin/env python
# -*- coding: utf-8 -*-
import numpy as np
import matplotlib.pyplot as plt

cs = ['black', 'blue', 'brown', 'red', 'yellow', 'green']


class NpCluster(object):
    def __init__(self):
        self.key = []
        self.value = []

    def append(self, data):
        if str(data) in self.key:
            return
        self.key.append(str(data))
        self.value.append(data)

    def exist(self, data):
        if str(data) in self.key:
            return True
        return False

    def __len__(self):
        return len(self.value)

    def __iter__(self):
        self.times = 0
        return self

    def __next__(self):
        try:
            ret = self.value[self.times]
            self.times += 1
            return ret
        except IndexError:
            raise StopIteration()


def create_sample():
    np.random.seed(10)  # 随机数种子,保证随机数生成的顺序一样
    n_dim = 2
    num = 100
    a = 3 + 5 * np.random.randn(num, n_dim)
    b = 30 + 5 * np.random.randn(num, n_dim)
    c = 60 + 10 * np.random.randn(1, n_dim)
    data_mat = np.concatenate((np.concatenate((a, b)), c))
    ay = np.zeros(num)
    by = np.ones(num)
    label = np.concatenate((ay, by))
    return {'data_mat': list(data_mat), 'label': label}


def region_query(dataset, center_point, eps):
    result = NpCluster()
    for point in dataset:
        if np.sqrt(sum(np.power(point - center_point, 2))) <= eps:
            result.append(point)
    return result


def dbscan(dataset, eps, min_pts):
    noise = NpCluster()
    visited = NpCluster()
    clusters = []
    for point in dataset:
        cluster = NpCluster()
        if not visited.exist(point):
            visited.append(point)
            neighbors = region_query(dataset, point, eps)
            if len(neighbors) < min_pts:
                noise.append(point)
            else:
                cluster.append(point)
                expand_cluster(visited, dataset, neighbors, cluster, eps, min_pts)
                clusters.append(cluster)
    for data in clusters:
        print(data.value)
        plot_data(np.mat(data.value), cs[clusters.index(data)])
    if noise.value:
        plot_data(np.mat(noise.value), 'green')
    plt.show()


def plot_data(samples, color, plot_type='o'):
    plt.plot(samples[:, 0], samples[:, 1], plot_type, markerfacecolor=color, markersize=14)


def expand_cluster(visited, dataset, neighbors, cluster, eps, min_pts):
    for point in neighbors:
        if not visited.exist(point):
            visited.append(point)
            point_neighbors = region_query(dataset, point, eps)
            if len(point_neighbors) >= min_pts:
                for expand_point in point_neighbors:
                    if not neighbors.exist(expand_point):
                        neighbors.append(expand_point)
                if not cluster.exist(point):
                    cluster.append(point)


init_data = create_sample()
dbscan(init_data['data_mat'], 10, 3)
聚类结果:
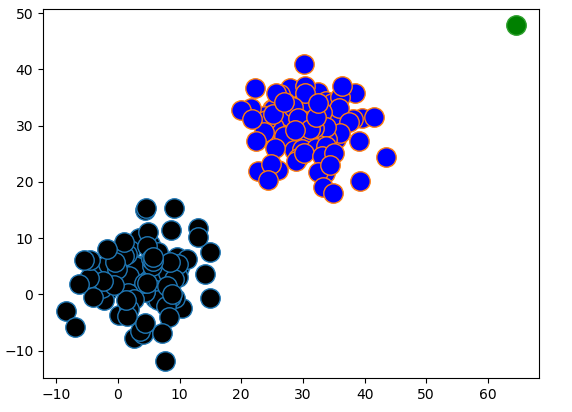
可以看到,点被很好的聚类为两个簇,右上角是噪声。

 浙公网安备 33010602011771号