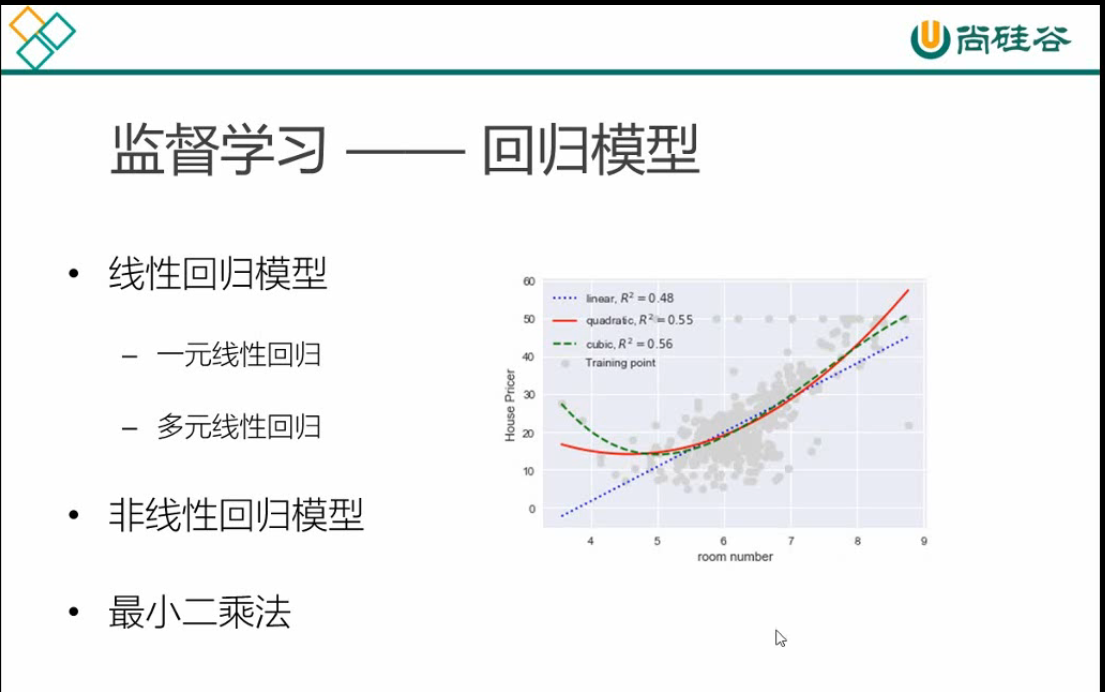
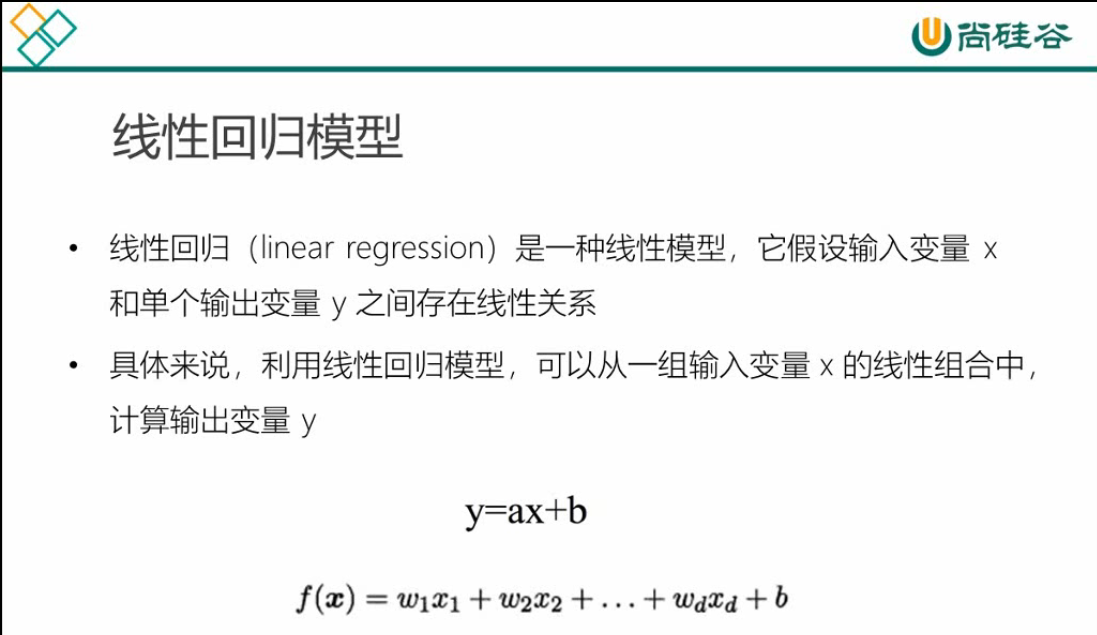
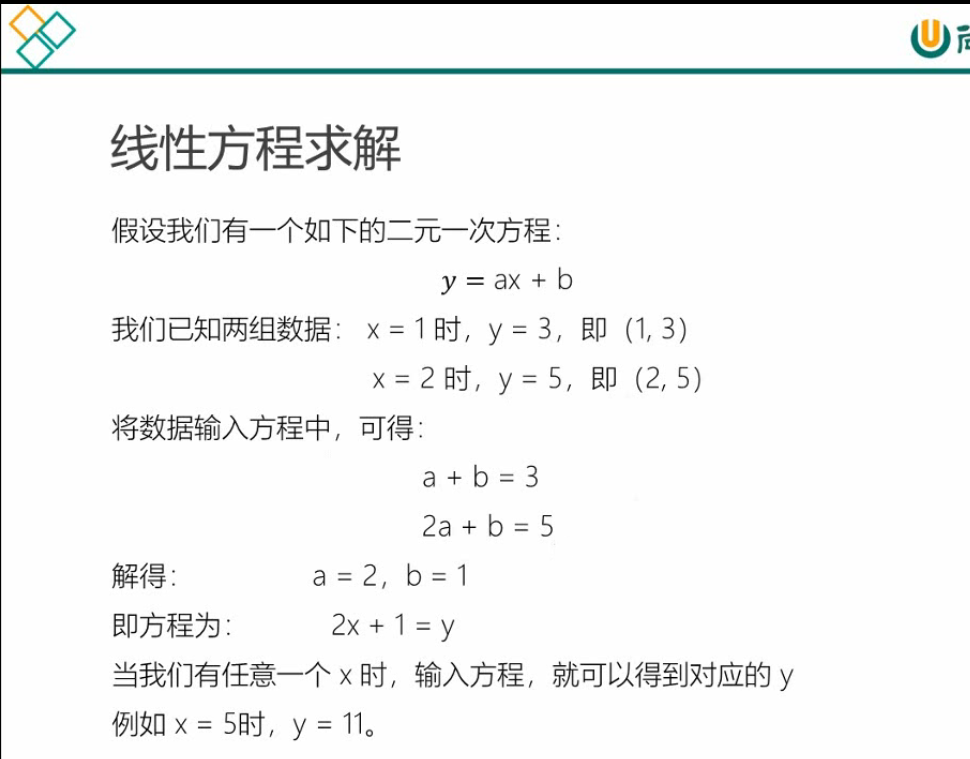
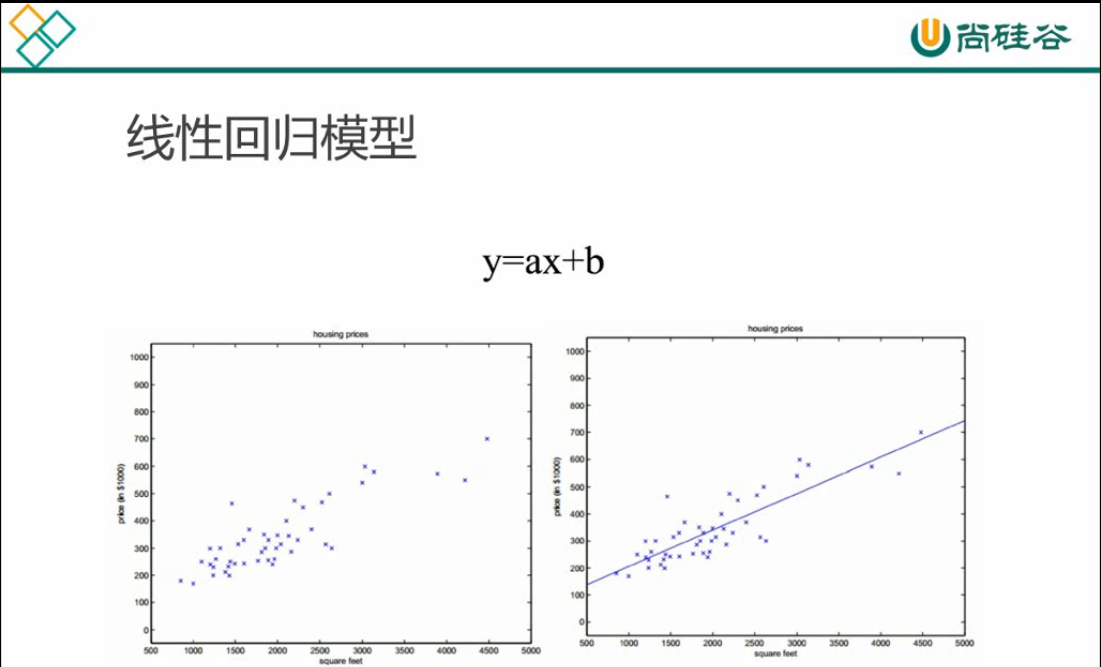
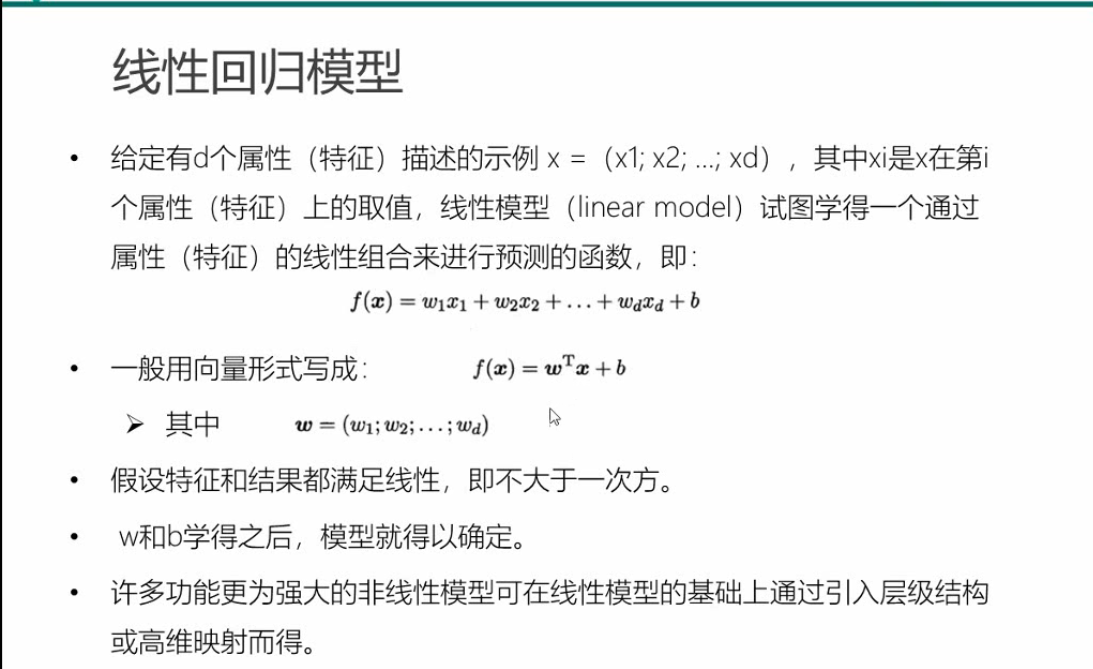
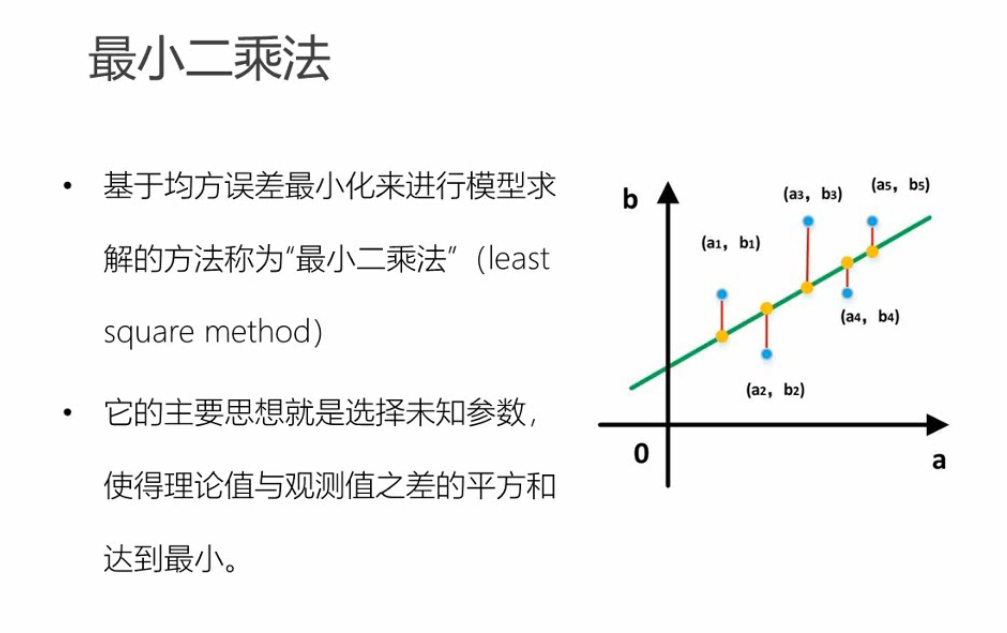
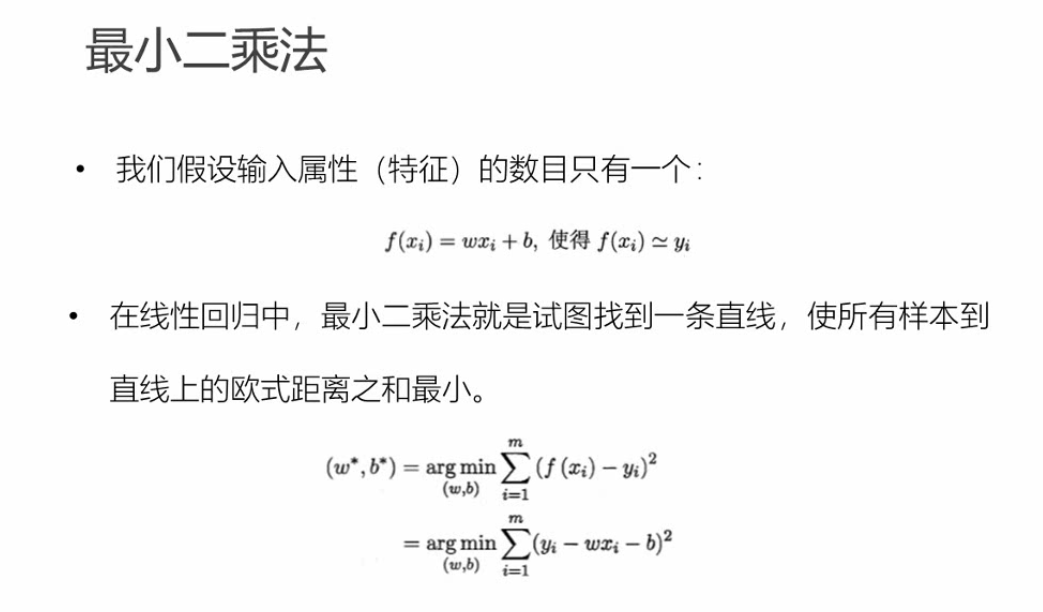
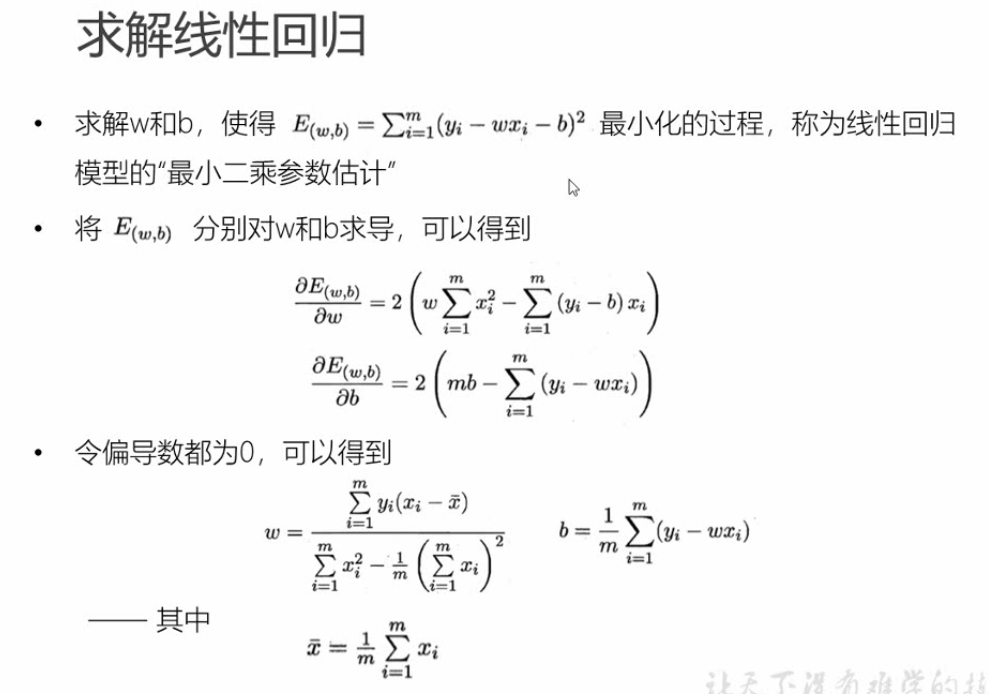
机器学习模型和算法 -----监督学习,线性回归算法,最小二乘法
Python 代码实现:
#导入numpy 和 matplotlib.pyplot 画图工具
import numpy as np import matplotlib.pyplot as plt
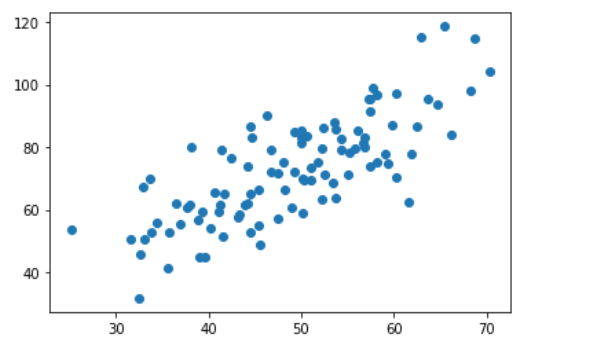
# 导入数据 data.csv (关于学习时间和学习成绩的向量数据)
points = np.genfromtxt('data.csv',delimiter=',')

x = points[:, 0] # python 可以直接使用[x,y]取得一组, 切片操作[a:b:c] 所以[:, 0]表示取所有行的第一列
y = points[:, 1] # [:, 0]表示取所有行的第二列
plt.scatter(x, y)# 散点图
plt.show() # 查看散点图
# 定义损失函数
def compute_cost(w, b, points):
    total_cost = 0
    M = len(points)

    #逐点计算平方损失误差,然后求平均数
    for i in range(M):
        x = points[i, 0]
        y = points[i, 1]
        total_cost += (y - w * x -b) ** 2

    return total_cost/M
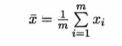
 # 定义均值函数
def average(data):
    sum = 0
    num = len(data)
    for i in range(num):
        sum += data[i]
    return sum/num

# 定义核心拟合合函数
def fit(points):
    M = len(points)
    x_bar = average(points[:, 0])

    sum_yx = 0
    sum_x2 = 0
    sum_delta = 0

    for i in range(M):
        x = points[i, 0]
        y = points[i, 1]
        sum_yx += y * (x - x_bar)
        sum_x2 += x ** 2
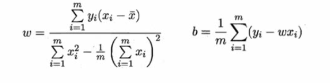
    w = sum_yx / (sum_x2 - M *(x_bar ** 2))

    for i in range(M):
        x = points[i, 0]
        y = points[i, 1]

        sum_delta += ( y - w * x )
    b = sum_delta / M

    return w, b
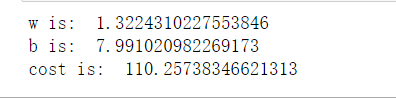
# 调用
w, b = fit(points)

print("w is: ", w)
print("b is: ", b)

cost = compute_cost(w, b, points)

print("cost is: ", cost)
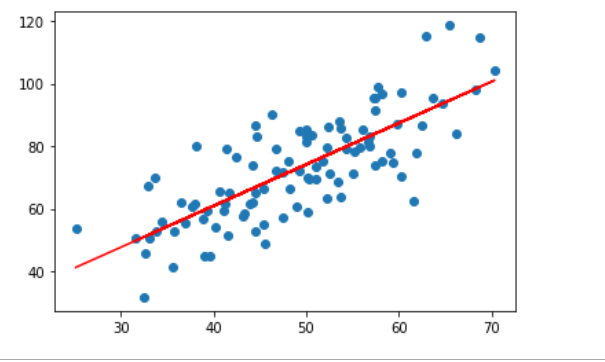
画出拟合曲线
plt.scatter(x, y)

pred_y = w * x + b

plt.plot(x, pred_y, c='r')
plt.show()
hello my world
本文来自博客园,作者:slowlydance2me,转载请注明原文链接:https://www.cnblogs.com/slowlydance2me/p/16827773.html
