vue echarts map的使用,页面多图动态自适应
最近在vue中使用echarts时,遇到了一些坑,在此记录一下。
1:echarts map的使用
2:页面多图自适应,只有一个图生效
3:根据设备的dpr,动态的修改了meta标签中的initial-scale,导致引入的类似于echarts这样的外部插件的字体也产生了缩放
在echarts3.x后,echarts不在内置地图数据,地图的json数据需要单独下载引入。在vue中使用时,地图的json文件在node_modules中的echarts中,并不需要单独下载了。
代码如下:
<template>
    <div class="map" id="s-map">
        <div id="chartMap" class="chartGauge" :style="{height:height,width:width}"></div>
    </div>
</template>

<script type="text/ecmascript-6">
   // 在之前已经单独引入了echarts文件
   // 在此只需引入需要的地区的json文件
    import gz from 'echarts/map/json/province/guizhou'

    export default {
        components: {

        },
        data () {
            return {
                font: '24'
            }
        },
        props: {
            width: {
                type: String,
                default: '200px'
            },
            height: {
                type: String,
                default: '400px'
            }
        },
        watch: {},
        methods: {
            drawmap() {
                let chartMap = document.getElementById('chartMap');
                let smap = document.getElementById('s-map');
          // 动态修改图表的宽高,达到自适应的效果
                var resizeWorldMapContainer = function () {
                    chartMap.style.width  = smap.clientWidth +'px';
                    chartMap.style.height = smap.clientHeight + 'px';
                };
                resizeWorldMapContainer();
                // 注册可用的地图
                echarts.registerMap('guizhou', gz);
                let myChart = echarts.init(chartMap);
                myChart.setOption({
                    roam: false,
                    series: [
                        {
                            name: '',
                            type: 'map',
                            map: 'guizhou',
                            mapType: '贵州',
                            roam: false,
                            zoom: 1.2,
                            itemStyle:{
                                normal:{
                                    areaColor: '#181d36',
                                    label:{
                                        show:true,
                                        textStyle: {
                                            color: '#fff',
                                            fontSize: this.font
                                        }
                                    },
                                },
                                emphasis:{
                                    areaColor: '#fff',
                                    label:{
                                        show:true,
                                        textStyle: {
                                            color: '#398def',
                                            fontSize: this.font
                                        }
                                    }

                                }
                            },
                            data:[
                                {name: '贵州',value: Math.round(Math.random()*1000)}
                            ]
                        }
                    ]
                });
                /*
                // window的方法在一个页面只加载一次,window.onresize只在一个图表中发生一次,因此在一个页面多图时,只有一个图会自适应
                window.onresize = function () {
                    resizeWorldMapContainer();
                    myChart.resize();
                };
                */
                window.addEventListener("resize", function(){
                    resizeWorldMapContainer();
                    myChart.resize();
                })
            }
        },
        filters: {},
        computed: {},
        created () {

        },
        mounted () {
            this.drawmap()
        },
        destroyed () {}
    }
</script>

<style lang="scss" scoped>
    @function px2rem($px) {
        $rem: 75px;
        @return ($px / $rem) + rem;
    }
</style>
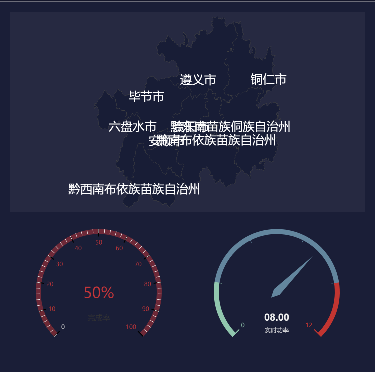
同一页面多图都达到自适应的效果,如下图,我在同一个页面中引入了map和gauge,分别属于不同的组件,每个组件中都有对图表自适应的设置,然后通过window.onresize进行处理,但是发现只有一个图表会自适应拖动效果。
window.onresize = function () {
   resizeWorldMapContainer();
   myChart.resize();
};
原因:wndow.onsize事件在同一页面中只会发生一次,因此会导致有点组件中window.onresize事件未发生
向window对象添加事件句柄
window.addEventListener("resize", function(){
   resizeWorldMapContainer();
   myChart.resize();
})
当修改了meta标签中的meta标签中的scale时,导致类似于echarts这样的库文字也会缩放,体验不好
动态修改meta中content的值,设置根节点字体大小
window.addEventListener('resize', () => {
    scale();
}, 300)

function scale(){
    let dpr = window.devicePixelRatio;

    let meta = document.getElementsByTagName("meta");
    //动态缩放
    meta[1].setAttribute('content', 'initial-scale=' + 1 / dpr + ', maximum-scale=' + 1/dpr + ', minimum-scale=' + 1/dpr + ', user-scalable=no')
    // 获取视窗宽度
    let htmlWidth = document.documentElement.clientWidth || document.body.clientWidth;

    // 获取视窗高度
    let _html = document.getElementsByTagName('html')[0];

    _html.style.fontSize = htmlWidth / 10 + 'px';
}

scale();
思路是这样的,获取页面的dpr,动态设置图表的fontSize = dpr*12 + 'px'即可正常显示。

 浙公网安备 33010602011771号