
多用途的Trace利器Chrome Trace Viewer,性能分析神器
强大的可视化利器 Chrome Trace Viewer 使用详解 | Limboy
In-depth: Using Chrome://tracing to view your inline profiling data
The tracing data format is a non-optimized JSON file containing a sequence of event blocks. Each block includes the following name/value pairs:
-
'cat' – the category for this event. Useful when doing larger grouping (eg "UnitUpdates")
-
'name' – the name of this event (eg 'PathingUpdate')
-
'pid' – the processor ID that spawned this event
-
'tid' – the thread ID that spawned this event
-
'ts' – the processor time stamp at the time this event was created
-
'ph' – the phase or type of this event
-
'args' – any programmatic metadata that's attached to this event
For an example, a JSON file with a single begin/end sample is listed below. Note that an event include descriptions of its category as well as its name. Some events occur in pairs, which are marked by complementary phases (B/E or S/F – read more about that below).
[
{
     "cat": "MY_SUBSYSTEM",  //catagory
     "pid": 4260,  //process ID
     "tid": 4776, //thread ID
     "ts": 2168627922668, //time-stamp of this event
     "ph": "B", // Begin sample
     "name": "doSomethingCostly", //name of this event
     "args": { //arguments associated with this event.
       }
},
]
Some sample data from the profiler's format. You can see there's a named category, as well as a name of the scoped event we're tracking. Some events come in pairs of phases (see below).
Track events (Tracing SDK) - Perfetto Tracing Docs
There are a few main types of track events:
-
Slices, which represent nested, time bounded operations. For example, a slice could cover the time period from when a function begins executing to when it returns, the time spent loading a file from the network or the time to complete a user journey.
-
Counters, which are snapshots of time-varying numeric values. For example, a track event can record instantaneous the memory usage of a process during its execution.
-
Flows, which are used to connect related slices that span different tracks together. For example, if an image file is first loaded from the network and then decoded on a thread pool, a flow event can be used to highlight its path through the system.
Understanding the phase ('ph') tag
Sample Begin/End events ( ph = B / E )
The most common event types are sample begin and sample end, denoted by setting the phase tag to "B" and "E" respectively. These events define the start and end points of a sampling time interval.
Instant events ( ph = I )
Instant events, denoted with an "I" phase tag, are great for tossing extra information into the stream to mark actions or events in your game, such as LevelLoadComplete, or SuperHugeMonsterStartedAttack. Instant markers in the timeline appear as small triangles. The visual difference is crucial when scrubbing over large portions of data.
Async Start/Finish events ( ph = S/F )
Async events can occur across multiple threads/processes. They are useful for tracing operations like texture loads that can start activity on other threads. The start of an async event is denoted by setting the phase tag to "S" (for start) and the end by setting the tag to "F" (for finish).
Event metadata (args)
Along with instances, chrome://tracing supports per-sample metadata (called args in the format), which can be filled in with name/value pairs of arbitrary data. This appends information to a specific event. Anyone who's scrubbed through inline profiling data will tell you that these types of markers are invaluable when you get barraged by a flood of samples with the same call stack and need a way to determine the data associated with each instance. Every Event and Instance can have annotated data associated with it, which is very helpful in tracking down unique data relating to a sample.
GitHub - walidbr/perfetto_c: C wrapper to use C++ perfetto API
DarkKowalski/tiny-event-trace: Profile your C code with chrome://tracing (github.com)
运行性能监控工具Minitrace使用方法_Guosheng-zZ的博客-CSDN博客
mmolch/ctef-profile: A simple one-file (github.com)
Leandros/tinyprofiler: Json generator for about:tracing / chrome://tracing profiler (github.com)
efficios/barectf: Generator of ANSI C tracers which output CTF data streams
KDAB/ctf2ctf: Common Trace Format to Chrome Trace Format converter (github.com)
Babeltrace · A trace manipulation toolkit
Common Trace Format
The Common Trace Format (CTF) is a binary trace format designed to be very fast to write without compromising great flexibility. It allows traces to be natively generated by any C/C++ application or system, as well as by bare-metal (hardware) components.
With CTF, all headers, contexts, and event fields written in binary files are described using a custom C-like, declarative language called the Trace Stream Description Language (TSDL). Numerous binary trace stream layouts may be described in TSDL thanks to CTF's extensive range of available field types.
Babeltrace is the reference implementation of the Common Trace Format. It is a trace conversion application/C library which is able to read and write CTF, supporting almost all its specified features. Babeltrace also ships with Python 3 bindings to make it easier to open a CTF trace and iterate on its events in seconds.
Tracing — Zephyr Project Documentation
ADVANCED trouble-shooting of critical real-time systems (eclipse.org)
其他工具
Tracealyzer
强大的可视化利器 Chrome Trace Viewer 使用详解 | Limboy
强大的可视化利器 Chrome Trace Viewer 使用详解
2020-03-21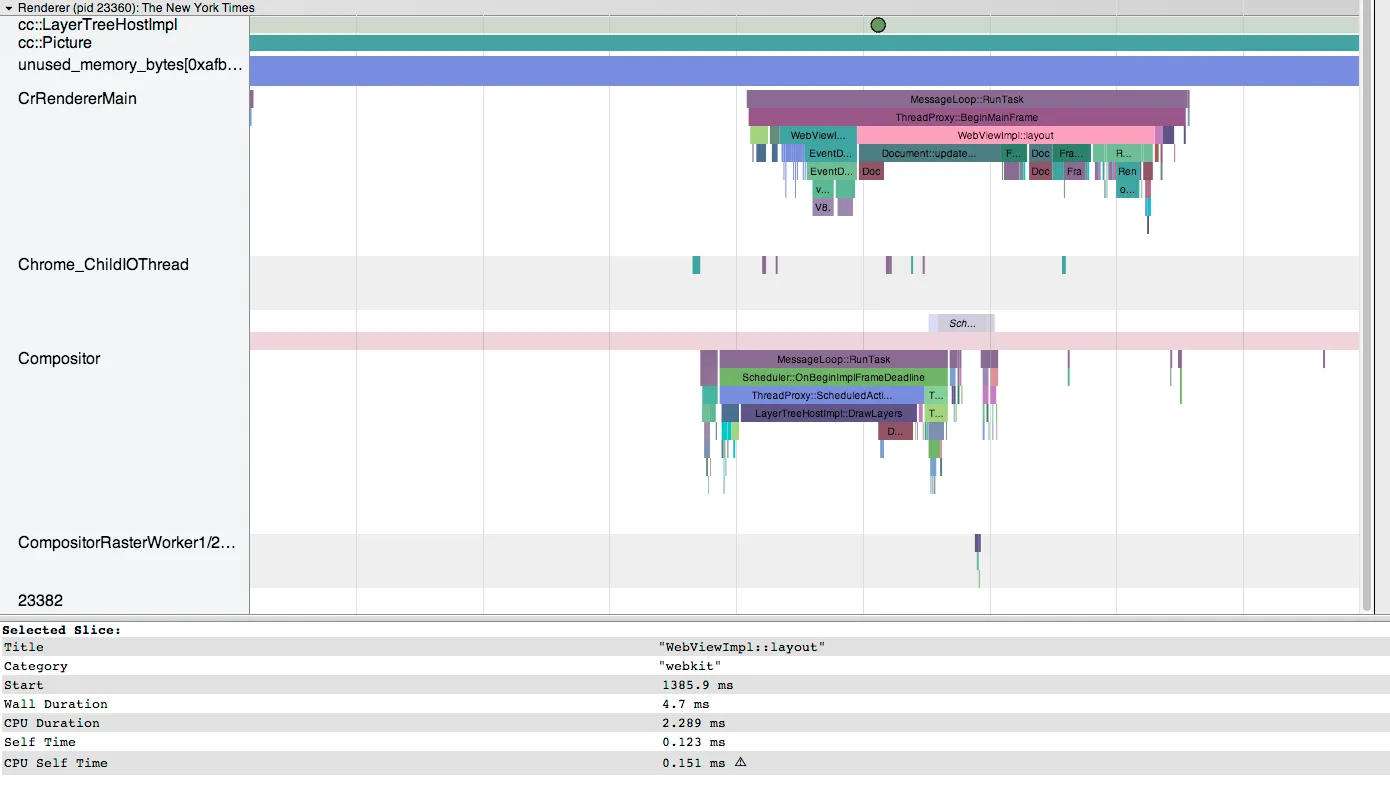
最近研究了下 Chrome 自带的 Trace Viewer,发现功能还挺强大的,用来做 Performance Profile,Timeline Tracing 等很方便,但官方的使用文档比较晦涩,资料也比较匮乏和分散,就专门整理了下。
注:Trace Viewer 其实可以脱离
chrome://tracing在线使用,具体操作后面会讲到
Trace Viewer 介绍
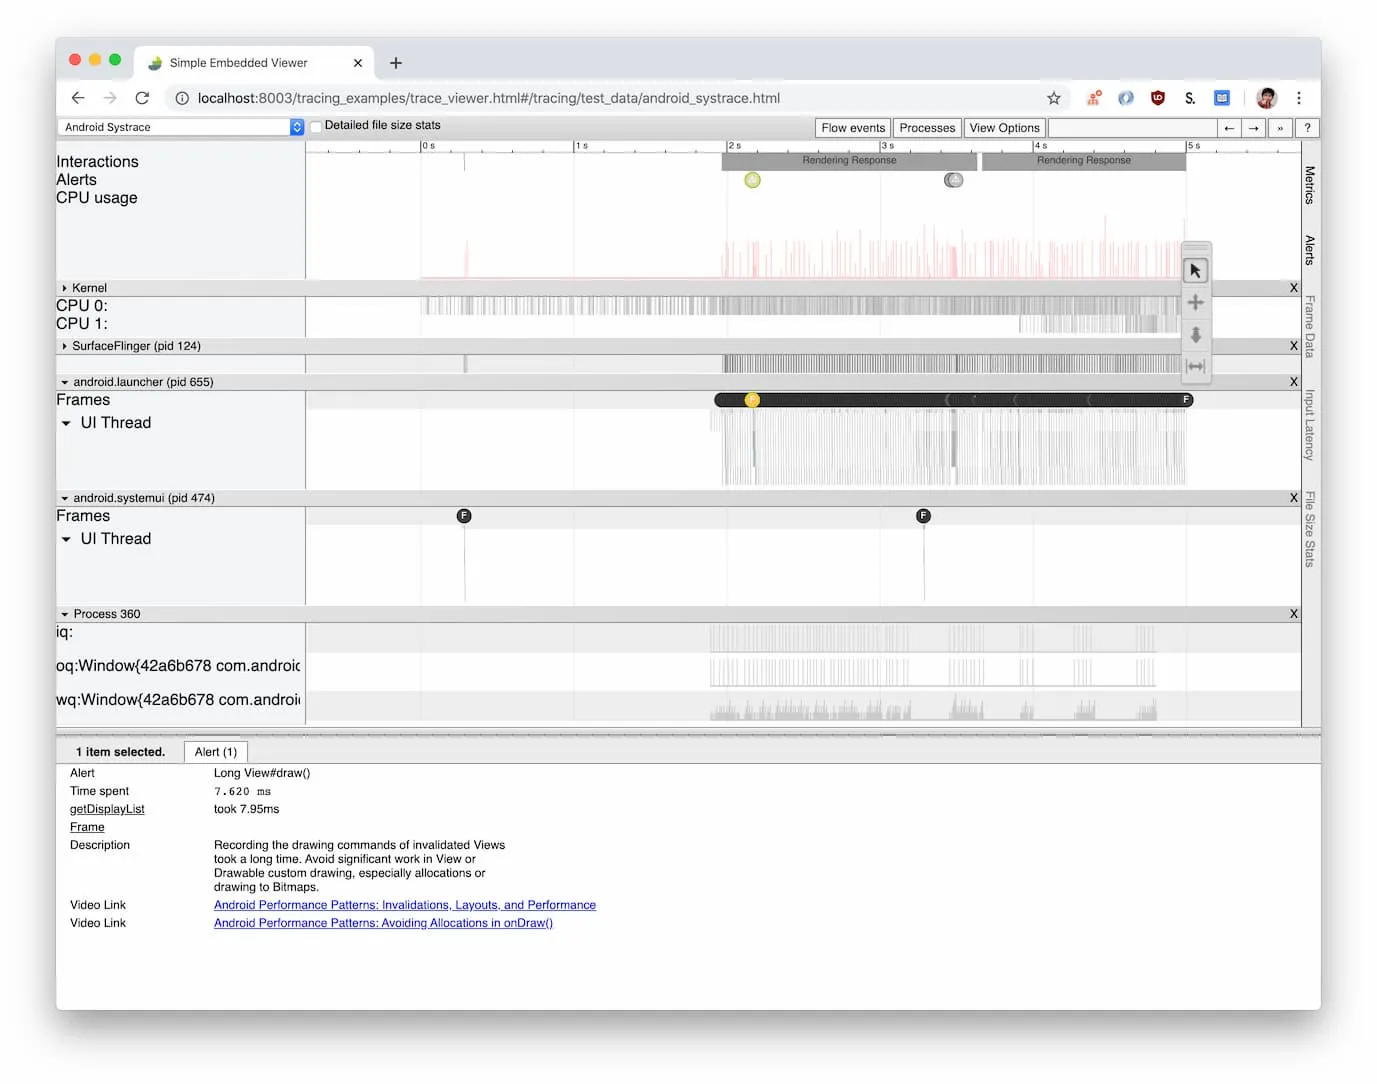
Trace-Viewer is the javascript frontend for Chrome
about:tracingand Androidsystrace. providing rich analysis and visualization capabilities for trace files, supporting both the linux kernel trace format and Chrome’s base/trace_event.
它是一个强大的可视化展示和分析工具,之前 google 有一个专门的 trace-viewer 项目,现在该项目合并到了 catapult 中, catapult 是 Chromium 工程师开发的一系列性能工具的合集,可以用来收集、展示、分析 Chrome、Website 甚至 Android 的性能。
catapult 源码里包含了很多 test case,git clone 下来后,运行 $CATAPULT/bin/run_dev_server. 然后在浏览器中打开 http://localhost:8003/tracing_examples/trace_viewer.html 能看到很多 Demo
不过 Google 目前正在开发另一套工具 perfetto 打算替换 Trace Viewer,我初步使用了下,感觉不如 Trace Viewer 简洁。
在开源项目中的使用
Golang 用它来可视化展示执行过程 https://golang.org/cmd/trace/
go test -trace trace.out pkg
go tool trace trace.out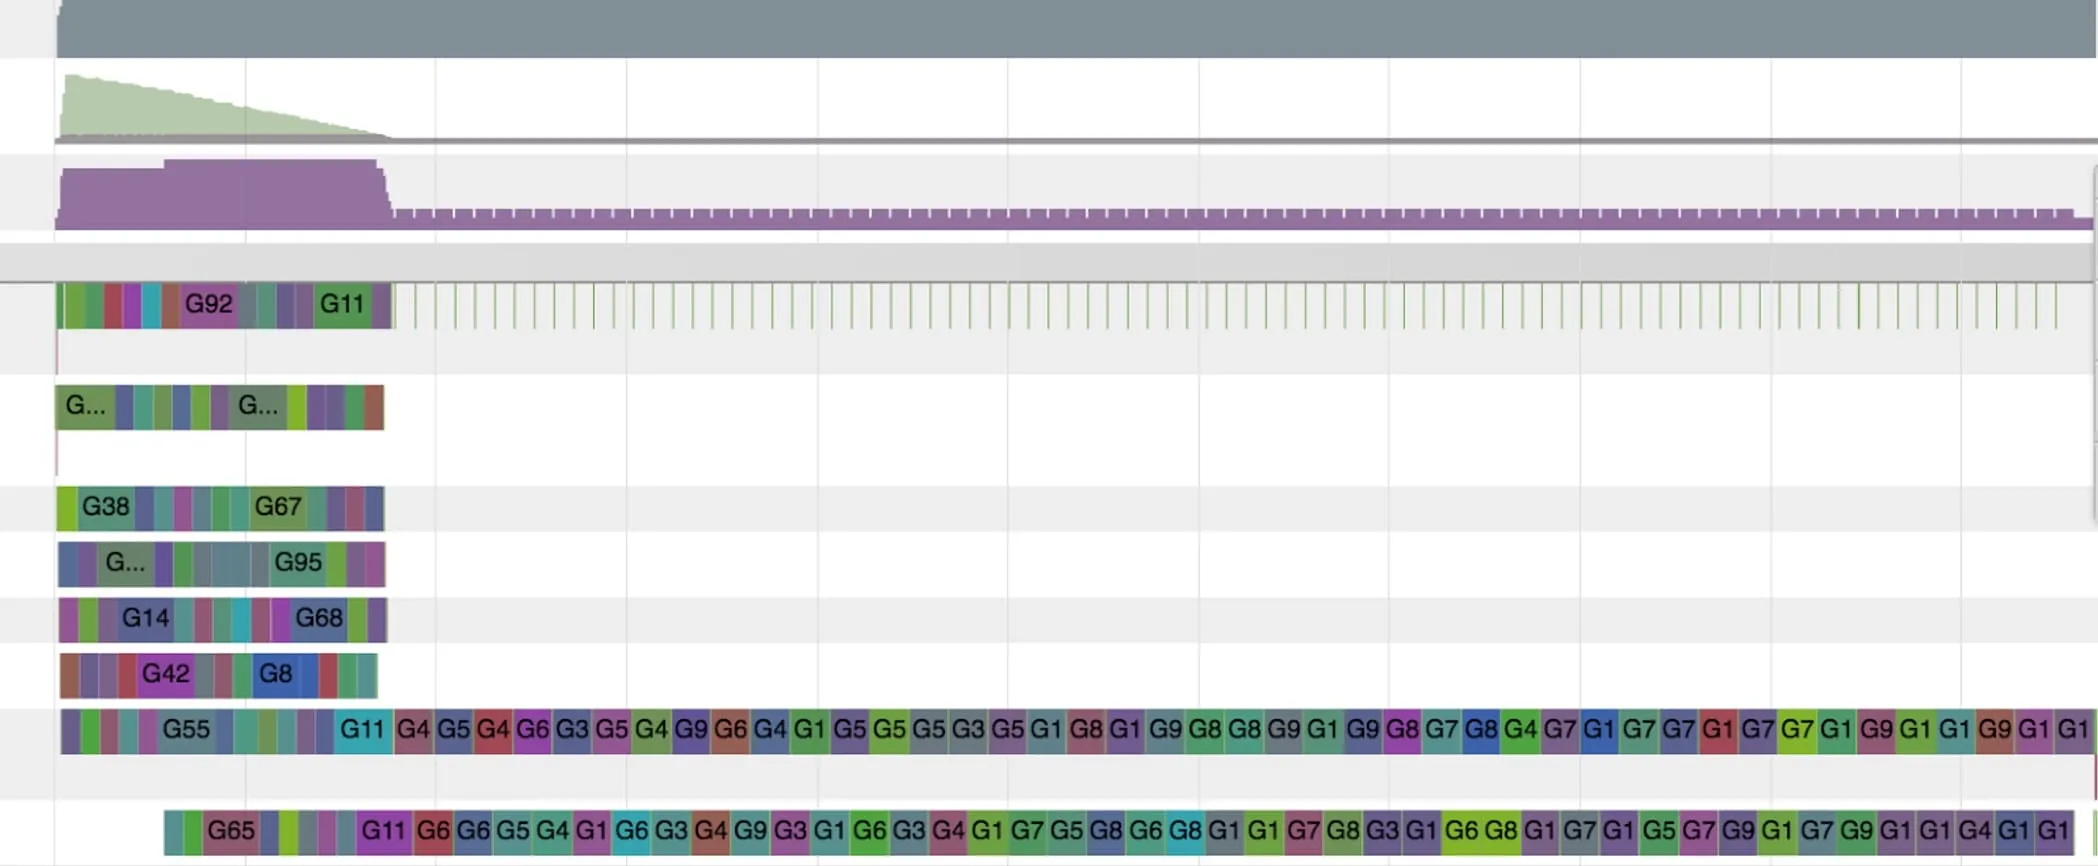
Facebook 的 Buck Build 系统,用它来展示 Build 时发生了什么
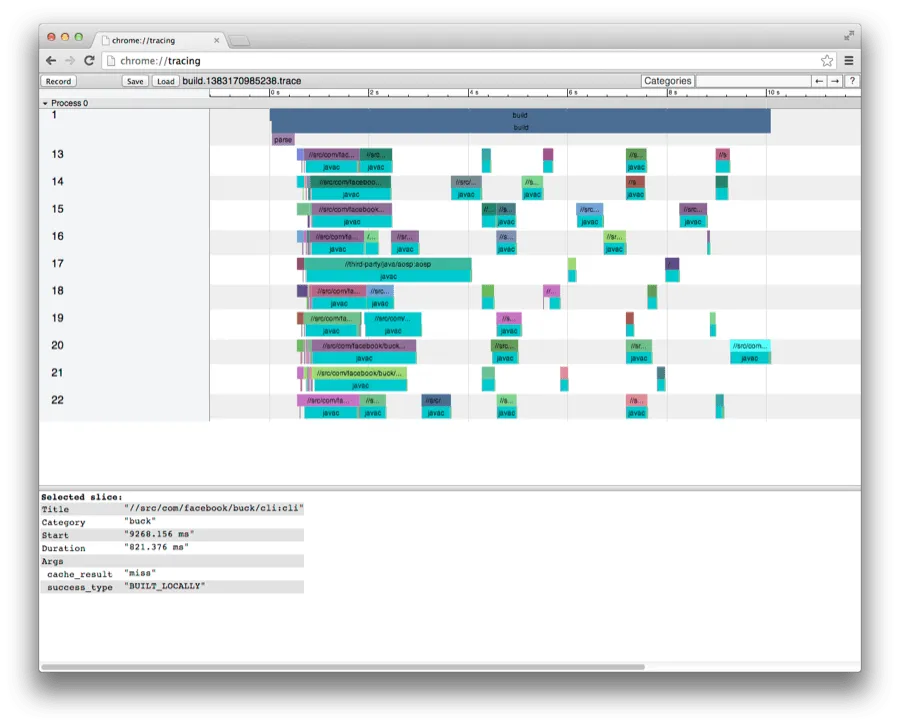
从这两个项目可以看出来 Trace Viewer 对于呈现「某段时间发生了什么」 还是有过人之处。
Trace Viewer Format
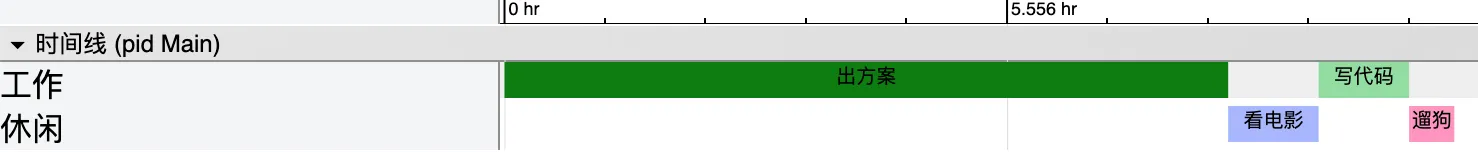
Trace Viewer 有一套自己的 Trace Event Format,只要文件遵循这个格式,就可以被展示。比如:

对应的 json 文件内容:
[ {"name": "出方案", "ph": "B", "pid": "Main", "tid": "工作", "ts": 0},
  {"name": "出方案", "ph": "E", "pid": "Main", "tid": "工作", "ts": 28800000000},
  {"name": "看电影", "ph": "B", "pid": "Main", "tid": "休闲", "ts": 28800000000},
  {"name": "看电影", "ph": "E", "pid": "Main", "tid": "休闲", "ts": 32400000000},
  {"name": "写代码", "ph": "B", "pid": "Main", "tid": "工作", "ts": 32400000000},
  {"name": "写代码", "ph": "E", "pid": "Main", "tid": "工作", "ts": 36000000000},
  {"name": "遛狗", "ph": "B", "pid": "Main", "tid": "休闲", "ts": 36000000000},
  {"name": "遛狗", "ph": "E", "pid": "Main", "tid": "休闲", "ts": 37800000000}
]
每一个 Event 主要由以下几部分组成:
{
  "name": "myName", // 事件名,会展示在 timeline 上
  "cat": "category,list", // 事件分类,类似 Tag,但 UI 上不支持选择 Tag
  "ph": "B", // phase,后面着重会讲到
  "ts": 12345, // 事件发生时的时间戳,以微秒表示
  "pid": 123, // 进程名
  "tid": 456, // 线程名
  "args": { // 额外参数,当选中某个 event 后,会在底部的面板展示
    "someArg": 1,
    "anotherArg": {
      "value": "my value"
    }
  }
}
其中最重要的是 ph,最常用的组合是 B 和 E,分别表示 Begin 和 End,有了这两个信息,Trace Viewer 就能在 timeline 上找到起止点,将它绘制出来。也可以简化为 X,然后加上 dur 表示 duration
[ {"name": "出方案", "ph": "X", "pid": "Main", "tid": "工作", "ts": 0, "dur": 28800000000},
  {"name": "看电影", "ph": "X", "pid": "Main", "tid": "休闲", "ts": 28800000000, "dur": 360000000},
  {"name": "写代码", "ph": "X", "pid": "Main", "tid": "工作", "ts": 32400000000, "dur": 360000000},
  {"name": "遛狗", "ph": "X", "pid": "Main", "tid": "休闲", "ts": 36000000000, "dur": 180000000},
]
但颜色看起来有点随机,能不能自定义呢,可以的,这时就要用到 cname 这个参数:
{"name": "出方案", "cname": "good", "ph": "X", "pid": "Main", "tid": "工作", "ts": 0, "dur": 28800000000},将 cname 设置为 good,视觉上会看到绿色,在这里有可选的 cname 列表(藏的真够深···)
左边的 Process Main 能不能也进行个性化定制以显得不那么突兀呢?比如将它改成「时间线」
这就要使用 MetaData Phase 了
{"name": "process_name", "ph": "M", "pid": "Main", "tid": "工作", "args": {"name": "时间线"}}它的表示方式是将 ph 设为 M,然后将 name 设为 5 种可选值中的一种,比如 process_name 则表示要对进程名做一些定制。metadata 主要是用来为某一类 event 提供更多的信息,比如自定义名字或重新设置排序优先级。
有一些事件,它不是执行耗时,但包含了其他事件,比如「我的一天」,它不是一个可被执行的事件,但将一天做的事情包含进来。这些被称为「异步事件」,表现上就像这样:
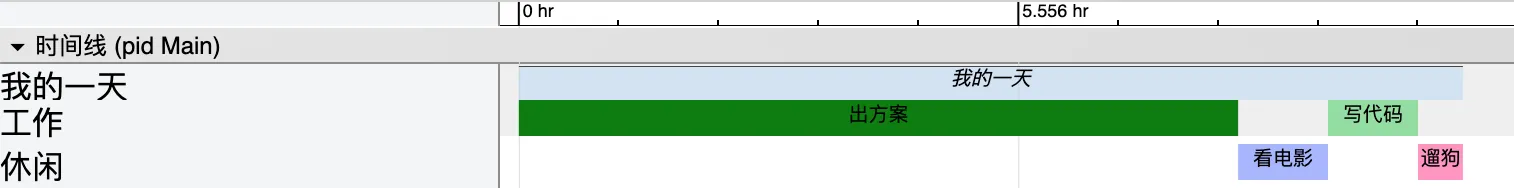
独占一栏,同时使用了斜体字,如果仔细看,还会发现顶部多了一条黑色的线。异步事件的 ph 为 b 和 e 也是 Begin 和 End,只不过变成了小写,同时还要提供 id 和 cat
[
  {"name": "我的一天", "ph": "b", "cat": "daily", "id": "my-day", "pid": "Main", "tid": "工作", "ts": 0},
  {"name": "我的一天", "ph": "e", "cat": "daily", "id": "my-day", "pid": "Main", "tid": "工作", "ts": 37800000000},
]
id 用来唯一标识两个异步事件是不是应该被作为同一个来看待(有可能多个异步事件名字都一样),cat 也是必选项,这个不太理解,可能等待的时间太孤独,需要一只猫来陪伴吧。
一件事可能会被拆分为更小的单元,然后执行过程中也会穿插着其他的事件,针对这样的场景,可以通过 Flow Event 来表示
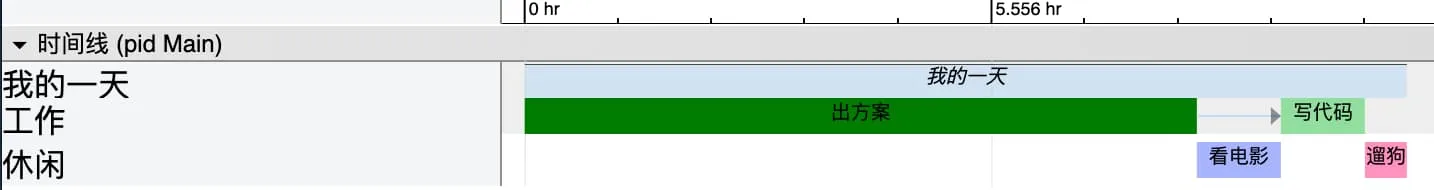
注意,在「出方案」和「写代码」之间多了一条线
{"name": "出方案", "cname": "good","ph": "X", "pid": "Main", "tid": "工作", "ts": 0, "dur": 28800000000},
{"name": "connect", "ph": "s", "id": "my-work", "pid": "Main", "tid": "工作", "ts": 28800000000},
{"name": "connect", "ph": "f", "bp": "e", "id": "my-work", "pid": "Main", "tid": "工作", "ts": 32400000000},
{"name": "写代码", "ph": "X", "pid": "Main", "tid": "工作", "ts": 32400000000, "dur": 3600000000},
Flow Event ph 的开始和结束分别为 s(start) 和 f(finish),跟 Async Event 有点像,但有几点不同:
- 不需要带上 cat
- 同一个 Flow Event,除了 id 相同外,名字也必须相同
- 结束时用
"bp": "e"来表示
Flow Event 需要依附在已有的 Event 上,依附的过程其实就是 ts 匹配,相同/最近 ts 的 Event 会自动被匹配到。
出方案的过程中,可能会有纪念意义的事件需要记录下,比如想到了某个点子,这时可以用 ph: "I" 来表示(Instant)
{"name": "想到一个点子", "ph": "I", "pid": "Main", "tid": "工作", "ts": 18800000000}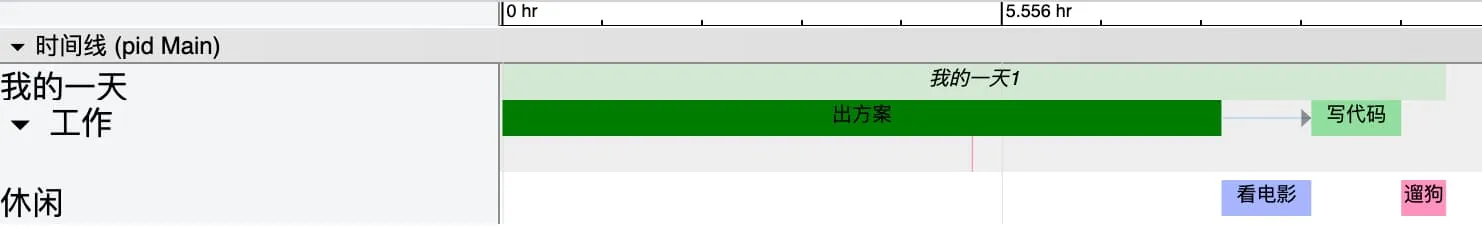
中间那根红线就是我们刚加的事件,选中之后会在底部出现该事件的详细信息。
作为一个上进的青年,一天下来之后,需要留一段时间反思今天做的好的和不好的,这可以通过 Snapshot 来体现,就像这样
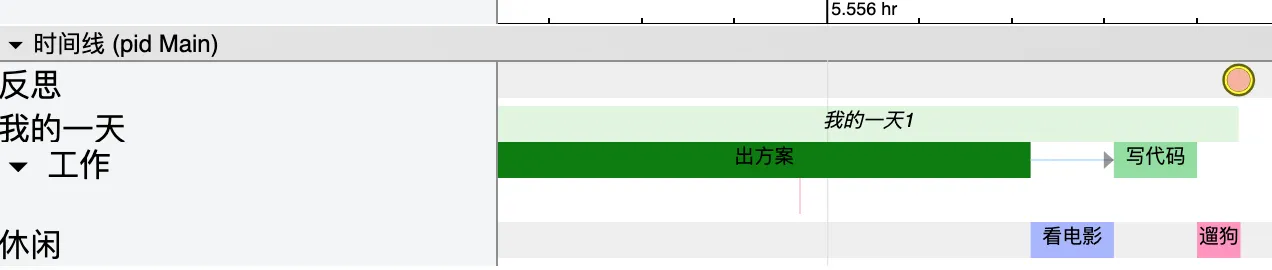
右上角那个圆点就是 Snapshot 在 Timeline 上的表现,点击之后可以在底部看到详细内容。
{"name": "反思", "ph": "O", "id": "Ref", "pid": "Main", "tid": "其他", "ts": 37800000000, "args": {"snapshot": "充实的一天呢"}}Snapshot 的 ph 为 O (字母 O),没有什么限制,详细的内容往 args.snapshot 里放就可以了。
这些差不多就是常用的 ph 了,部分 ph 会有附带的规则,再简单总结下:
ph B/E // 正常的开始/结束事件,最常见,也可以用 X + dur 来表示
ph M // Metadata 用来对一类 Event 附加更详细的信息,可以带来 UI 上的变化
ph I // 瞬时事件,类似 Mark 一下
ph s/e // 异步事件,表示自定义的一个事件,表现上跟正常事件会有区别
ph s/f // Flow 事件,会出现箭头,要通过 ts 匹配最近的 event,结束要使用 bp: e
ph O // Snapshot,表现上是一个醒目的圆点,可以在 `args.snapshot` 里放任意数据
以下是 Demo 对应的 Event 内容,只要能生成这样的 JSON 文件,就可以使用 Trace Viewer 强大的可视化能力。
[
  {"name": "我的一天", "ph": "b", "cat": "daily", "id": "my-day", "pid": "Main", "tid": "工作", "ts": 0},
  {"name": "我的一天1", "ph": "e", "cat": "daily", "id": "my-day", "pid": "Main", "tid": "工作", "ts": 37800000000},

  {"name": "出方案", "cname": "good","ph": "X", "pid": "Main", "tid": "工作", "ts": 0, "dur": 28800000000},
  {"name": "想到一个点子", "ph": "I", "pid": "Main", "tid": "工作", "ts": 18800000000},
  {"name": "connect", "ph": "s", "id": "my-work", "pid": "Main", "tid": "工作", "ts": 28800000000},
  {"name": "connect", "ph": "f", "bp": "e", "id": "my-work", "pid": "Main", "tid": "工作", "ts": 32400000000},
  {"name": "写代码", "ph": "X", "pid": "Main", "tid": "工作", "ts": 32400000000, "dur": 3600000000},

  {"name": "反思", "ph": "O", "id": "Ref", "pid": "Main", "tid": "其他", "ts": 37800000000, "args": {"snapshot": "充实的一天呢"}},

  {"name": "看电影", "ph": "B", "pid": "Main", "tid": "休闲", "ts": 28800000000},
  {"name": "看电影", "ph": "E", "pid": "Main", "tid": "休闲", "ts": 32400000000},

  {"name": "遛狗", "ph": "X", "pid": "Main", "tid": "休闲", "ts": 36000000000, "dur": 1880000000},
  {"name": "process_name", "ph": "M", "pid": "Main", "tid": "工作", "args": {"name": "时间线"}}
]
在线使用 Trace Viewer
通过 chrome://tracing 的方式来使用 Tracer Viewer 还是不太方便,也不利于传播,Google 虽然在 catapult 里提供了 trace2html,但包含的文件很多,使用起来还是有点麻烦,于是参考了 go trace 的源码,把相关文件上传到了 CDN,然后在一个 html 文件里引用,这样只需一个文件即可。
<!DOCTYPE html>
<!--
Copyright (c) 2014 The Chromium Authors. All rights reserved.
Use of this source code is governed by a BSD-style license that can be
found in the LICENSE file.
-->

<head>
  <meta http-equiv="Content-Type" content="text/html; charset=UTF-8" />
  <style>
    body {
      font-family: arial, sans-serif;
    }
  </style>
  <script
    src="https://sf1-ttcdn-tos.pstatp.com/obj/developer-baas/baas/ttnbrzs5vgcryya2z2/7d1b75402231d1cd_1583755520315.js"></script>
  <script>
    'use strict';
    window.__hideTraceViewerPolyfillWarning = true;

    function onTraceViewerImportFail() {
      document.addEventListener('DOMContentLoaded', function () {
        document.body.textContent =
          'tracing/bin/trace_viewer_full.html is missing. ' +
          'Run vulcanize_trace_viewer from $TRACE_VIEWER and reload.';
      });
    }
  </script>
  <link rel="import"
    href="https://sf1-ttcdn-tos.pstatp.com/obj/developer-baas/baas/ttnbrzs5vgcryya2z2/4b94a178762f4049_1583756222365.html"
    onerror="onTraceViewerImportFail(event)">
  <style>
    html,
    body {
      box-sizing: border-box;
      overflow: hidden;
      margin: 0px;
      padding: 0;
      width: 100%;
      height: 100%;
    }

    #trace-viewer {
      width: 100%;
      height: 100%;
    }

    #trace-viewer:focus {
      outline: none;
    }
  </style>
  <script>
    'use strict';

    (function () {
      var viewer;
      var url;
      var model;

      function load() {
        var req = new XMLHttpRequest();
        var isBinary = /[.]gz$/.test(url) || /[.]zip$/.test(url);
        req.overrideMimeType('text/plain; charset=x-user-defined');
        req.overrideMimeType('contentType: "application/x-www-form-urlencoded;charset=utf-8"');
        console.log(url);
        req.open('GET', url, true);
        if (isBinary)
          req.responseType = 'arraybuffer';

        req.onreadystatechange = function (event) {
          if (req.readyState !== 4)
            return;

          window.setTimeout(function () {
            if (req.status === 200)
              onResult(isBinary ? req.response : req.responseText);
            else
              onResultFail(req.status);
          }, 0);
        };
        req.send(null);
      }

      function onResultFail(err) {
        var overlay = new tr.ui.b.Overlay();
        overlay.textContent = err + ': ' + url + ' could not be loaded';
        overlay.title = 'Failed to fetch data';
        overlay.visible = true;
      }

      function onResult(result) {
        model = new tr.Model();
        var i = new tr.importer.Import(model);
        var p = i.importTracesWithProgressDialog([result]);
        p.then(onModelLoaded, onImportFail);
      }

      function onModelLoaded() {
        viewer.model = model;
        var urlParams = new URLSearchParams(window.location.search);
        var title = urlParams.get("title") || "";
        document.getElementById('title').innerHTML = title;
      }

      function onImportFail(err) {
        var overlay = new tr.ui.b.Overlay();
        overlay.textContent = tr.b.normalizeException(err).message;
        overlay.title = 'Import error';
        overlay.visible = true;
      }

      document.addEventListener('WebComponentsReady', function () {
        var container = document.createElement('track-view-container');
        container.id = 'track_view_container';

        viewer = document.createElement('tr-ui-timeline-view');
        viewer.track_view_container = container;
        Polymer.dom(viewer).appendChild(container);

        viewer.id = 'trace-viewer';
        viewer.globalMode = true;
        Polymer.dom(document.body).appendChild(viewer);

        var urlParams = new URLSearchParams(window.location.search);
        url = urlParams.get("tracing_url");
        load();
      });
    }());
  </script>
</head>
<body>
</body>
</html>使用方式:http://path/to/this.html?tracing_url=path/to/tracing.json
踩过的坑
JSON 文件里,如果出现 AStart-BStart-AEnd-BEnd 这样的交叉式多行数据,有可能会导致解析失败。解决方法就是拆解为正常的顺序 AStart-AEnd-BStart-BEnd。
还有,如果发现某个 Event 的 Start 和 End 明明在那里,但却还是报找不到 End 的话,通常是这个 End 被其他 Start 匹配了(即使名字不一样),所以 root cause 很可能是因为那个 solo Start。
小结
Trace Viewer 是一款强大的可视化利器,虽然通常被拿来做性能分析,但它的使用场景其实很广,至于能做出什么来,就看你的想象力咯。
强大的可视化利器 Chrome Trace Viewer 使用详解 | Limboy

 浙公网安备 33010602011771号