
伯努利分布
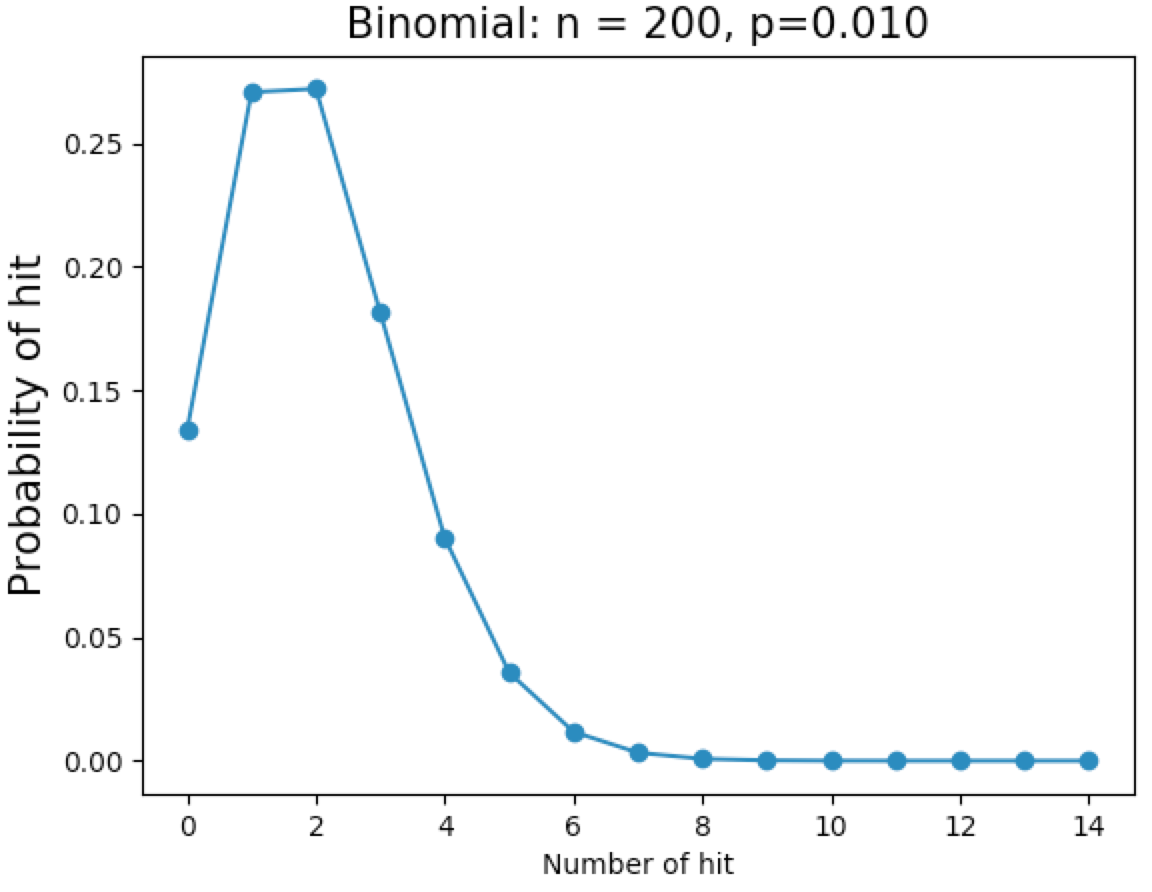
#coding:utf-8
from scipy.stats import binom
import matplotlib.pyplot as plt
import numpy as np

#样本数目
n = 200
#发生的概率
p = 0.01
#发生的次数
k = np.arange(0,15)
binomial = binom.pmf(k, n, p)

plt.plot(k, binomial, 'o-')
plt.title('Binomial: n = %i, p=%0.3f' % (n, p),fontsize = 15)
plt.xlabel('Number of hit')
plt.ylabel('Probability of hit', fontsize = 15)
plt.show()

 浙公网安备 33010602011771号