
Backtrader中文笔记之CSV Data Feed Data - Multiple Timeframes(二次修复)
Data - Multiple Timeframes
Sometimes investing decisions are taken using different timeframes:
有时候,投资策略采用不同的时间框架
-
Weekly to evaluate the trend
- 每周的评估趋势
-
Daily to execute the entry
- 每天执行录入
Or 5 minutes vs 60 minutes.
或者5分钟对比60分钟
That implies that combining datas of multiple timeframes in backtrader is needed to support such combinations.
这意味着需要在backtrader中组合多个时间段的数据来支持这种配置。
Native support for it is already built-in. The end user must only follow these rules:
平台已经支持该配置,并且内置在系统。终端用户必须遵守以下规则:
-
The data with the smallest timeframe (and thus the larger number of bars) must be the 1st one to be added to the Cerebro instance
- 具有最小时间帧的数据(因此条数更多)必须是第一个添加到Cerebro实例的数据
-
The datas must be properly date-time aligned for the platform to make any sense out of them
- 数据必须正确地与日期和时间对齐,以便平台能够理解它们
Beyond that, the end-user is free to apply indicators as wished on the shorter/larger timeframes. Of course:
除此之外,终端用户可以自由地在较短/较大的时间框架上应用指标。当然,
- Indicators applied to larger timeframes will produce less bars
- 应用于较大时间框架的指标将产生较少的bars
The platform will also have the following into account
该平台还将考虑以下因素
- The minimum period for larger timeframes
- 大时间框架的最小周期
Minimum period which will probably have the side effect of having to consume several orders of magnitude of the smaller timeframe bars before a Strategy added to Cerebro kicks into action.
最小时间周期,这可能会有副作用,在大脑的策略开始行动之前,必须消耗几个数量级的小时间框架。[重构时间框架要用到]
The built-in cerebro.resample is going to be used to create a larger timeframe.
内置cerebro.resample将用于创建更大的时间框架。
Some examples below, but first the sauce of the test script.
下面是一些示例,但首先是测试脚本。
    # Load the Data
    datapath = args.dataname or '../../datas/2006-day-001.txt'
    data = btfeeds.BacktraderCSVData(dataname=datapath)
    cerebro.adddata(data)  # First add the original data - smaller timeframe

    tframes = dict(daily=bt.TimeFrame.Days, weekly=bt.TimeFrame.Weeks,
                   monthly=bt.TimeFrame.Months)

    # Handy dictionary for the argument timeframe conversion
    # Resample the data
    if args.noresample:
        datapath = args.dataname2 or '../../datas/2006-week-001.txt'
        data2 = btfeeds.BacktraderCSVData(dataname=datapath)
        # And then the large timeframe
        cerebro.adddata(data2)
    else:
        cerebro.resampledata(data, timeframe=tframes[args.timeframe],
                             compression=args.compression)

    # Run over everything
    cerebro.run()
The steps:
步骤
-
Load a data
- 读取数据
-
Resample it according to the user specified arguments
The script also allows for loading a 2nd data
- 根据用户指定的参数重新取样
该脚本还允许加载第二个数据 -
Add the data to cerebro
- 将数据添加到cerebro
-
Add the resampled data (larger timeframe) to cerebro
- 将重新采样的数据(更大的时间框架)添加到cerebro
-
run
Example 1 - Daily and Weekly
The invocation of the script:
$ ./multitimeframe-example.py --timeframe weekly --compression 1
转换成周线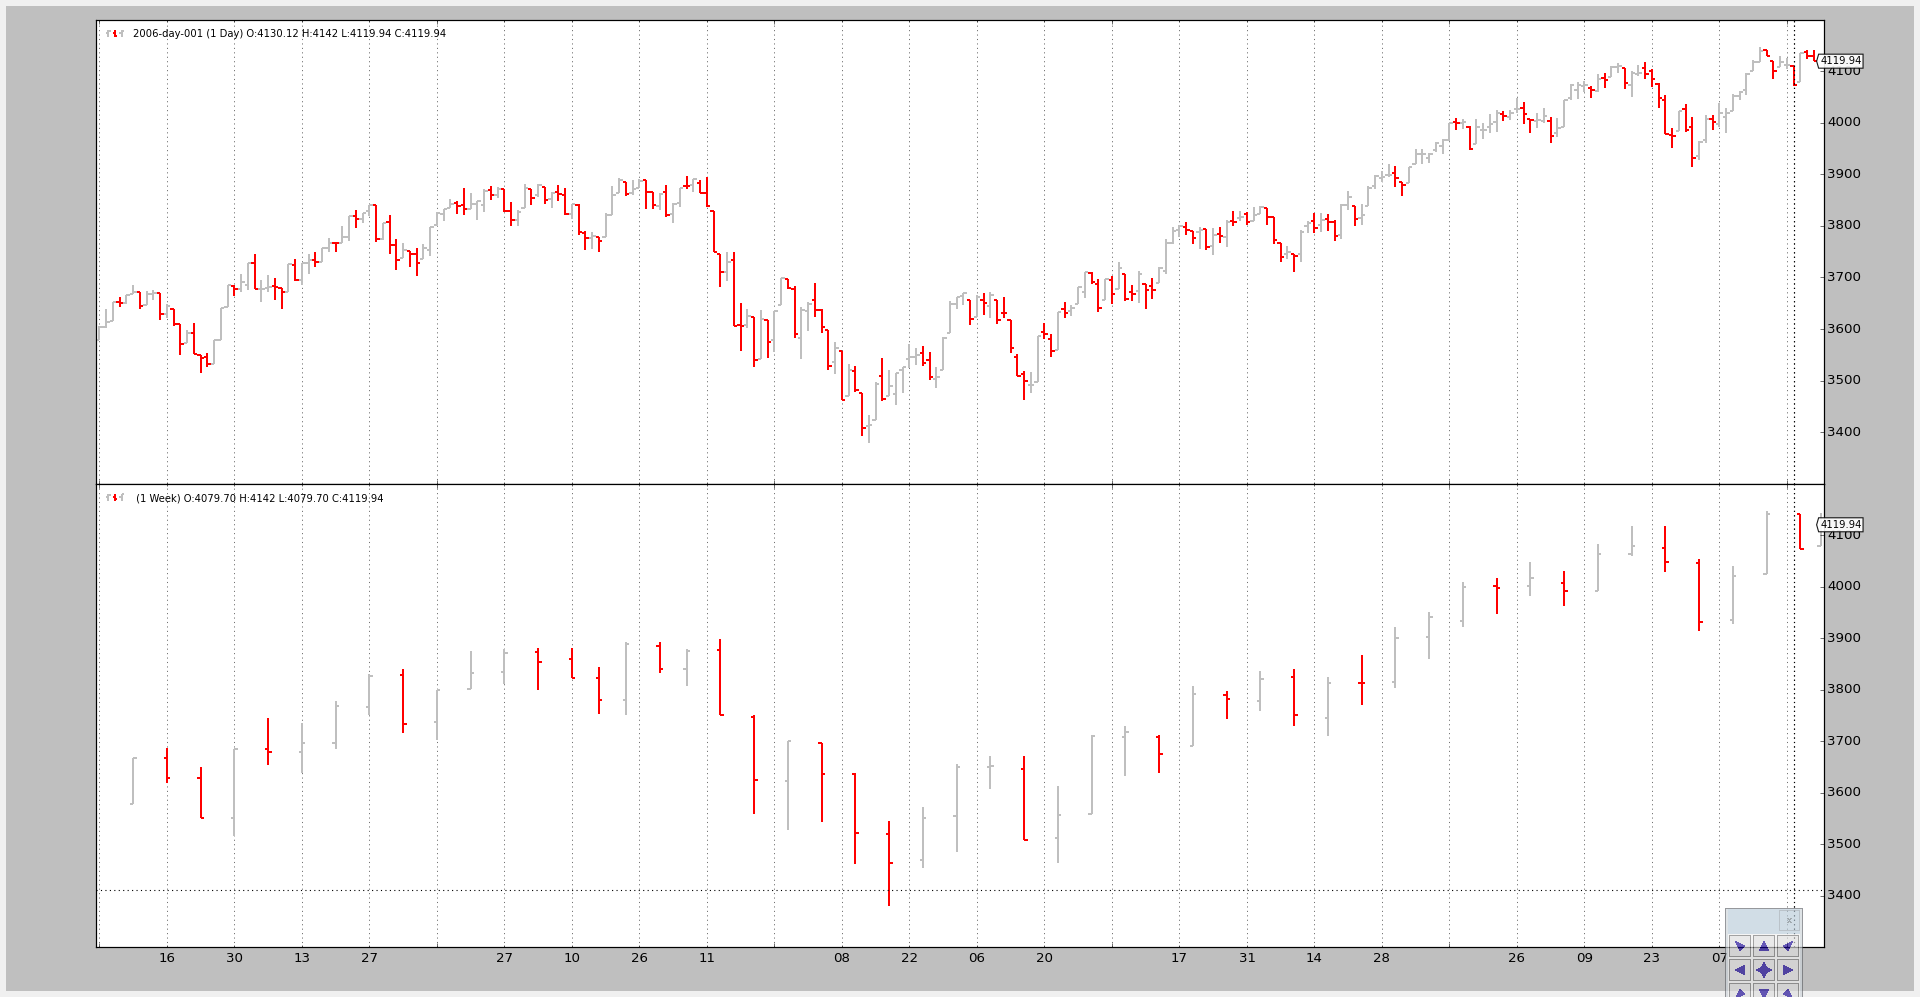
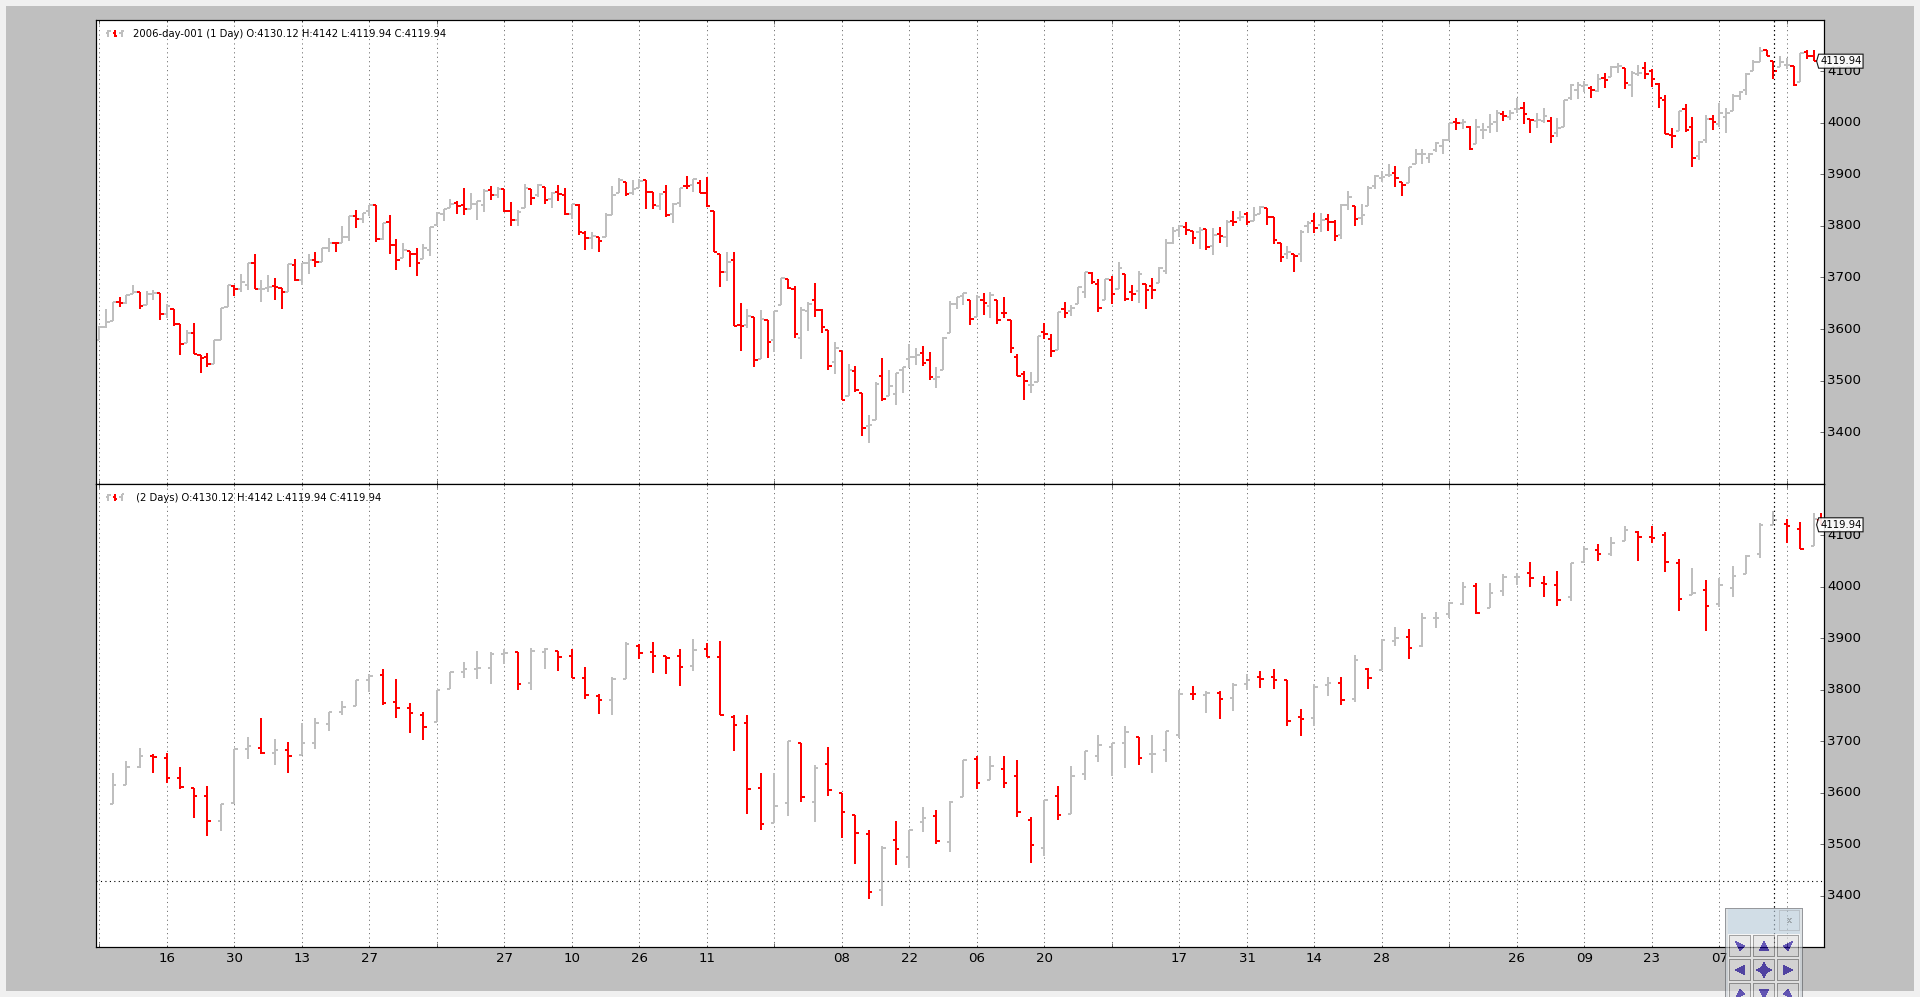
Example 2 - Daily and Daily Compression (2 bars to 1)
The invocation of the script:
$ ./multitimeframe-example.py --timeframe daily --compression 2
And the output chart:
压缩日线
Example 3 - Strategy with SMA
Although plotting is nice, the key issue here is showing how the larger timeframe influences the system, especially when it comes down to the starting point
虽然绘制很好,但这里的关键问题是显示较大的时间框架如何影响系统,特别是当它到达起点时
The script can take a --indicators to add a strategy which creates simple moving averages of period 10 on the smaller an larger timeframe datas.
脚本可以采用—给策略添加一个指标,该指标在较小的时间段数据上创建10期的简单移动平均线。
If only the smaller timeframe was taken into account:
如果只考虑较小的时间框架:
-
nextwould be called first after 10 bars, which is the time the Simple Moving Average needs to produce a value -
next将在10个bar之后首先调用,这是简单移动平均值产生值所需的时间
NOTE: Remember that Strategy monitors created indicators and only calls
nextwhen all indicators have produced a value. The rationale is that the end user has added the indicators to use them in the logic and thus no logic should take place if the indicators have produced no values - 注意:记住,策略监视创建了指标,只有当所有指标都产生了值时才会调用next。其基本原理是,最终用户添加了指标以在逻辑中使用它们,因此,如果指标没有产生任何值,则不应产生逻辑
But in this case the larger timeframe (weekly) delays the invocation of next until the Simple Moving Average oon the weekly data has produced a value, which takes … 10 weeks.
但在这种情况下,较大的时间范围(每周)会延迟next的调用,直到每周数据的简单移动平均值产生值,这需要…10周
The script overrides nextstart which is only called once and which defaults to calling next to show when it is first called.[小周期的会覆盖掉,只会调用一次nextstart]
该脚本覆盖只调用一次的nextstart,它默认在第一次调用时调用next来显示。
Invocation 1:
Only the smaller timeframe, daily, gets a Simple Moving Average
只选择小时间框架日线,取得平均线
The command line and output
$ ./multitimeframe-example.py --timeframe weekly --compression 1 --indicators --onlydaily
--------------------------------------------------
nextstart called with len 10
--------------------------------------------------
And the chart.

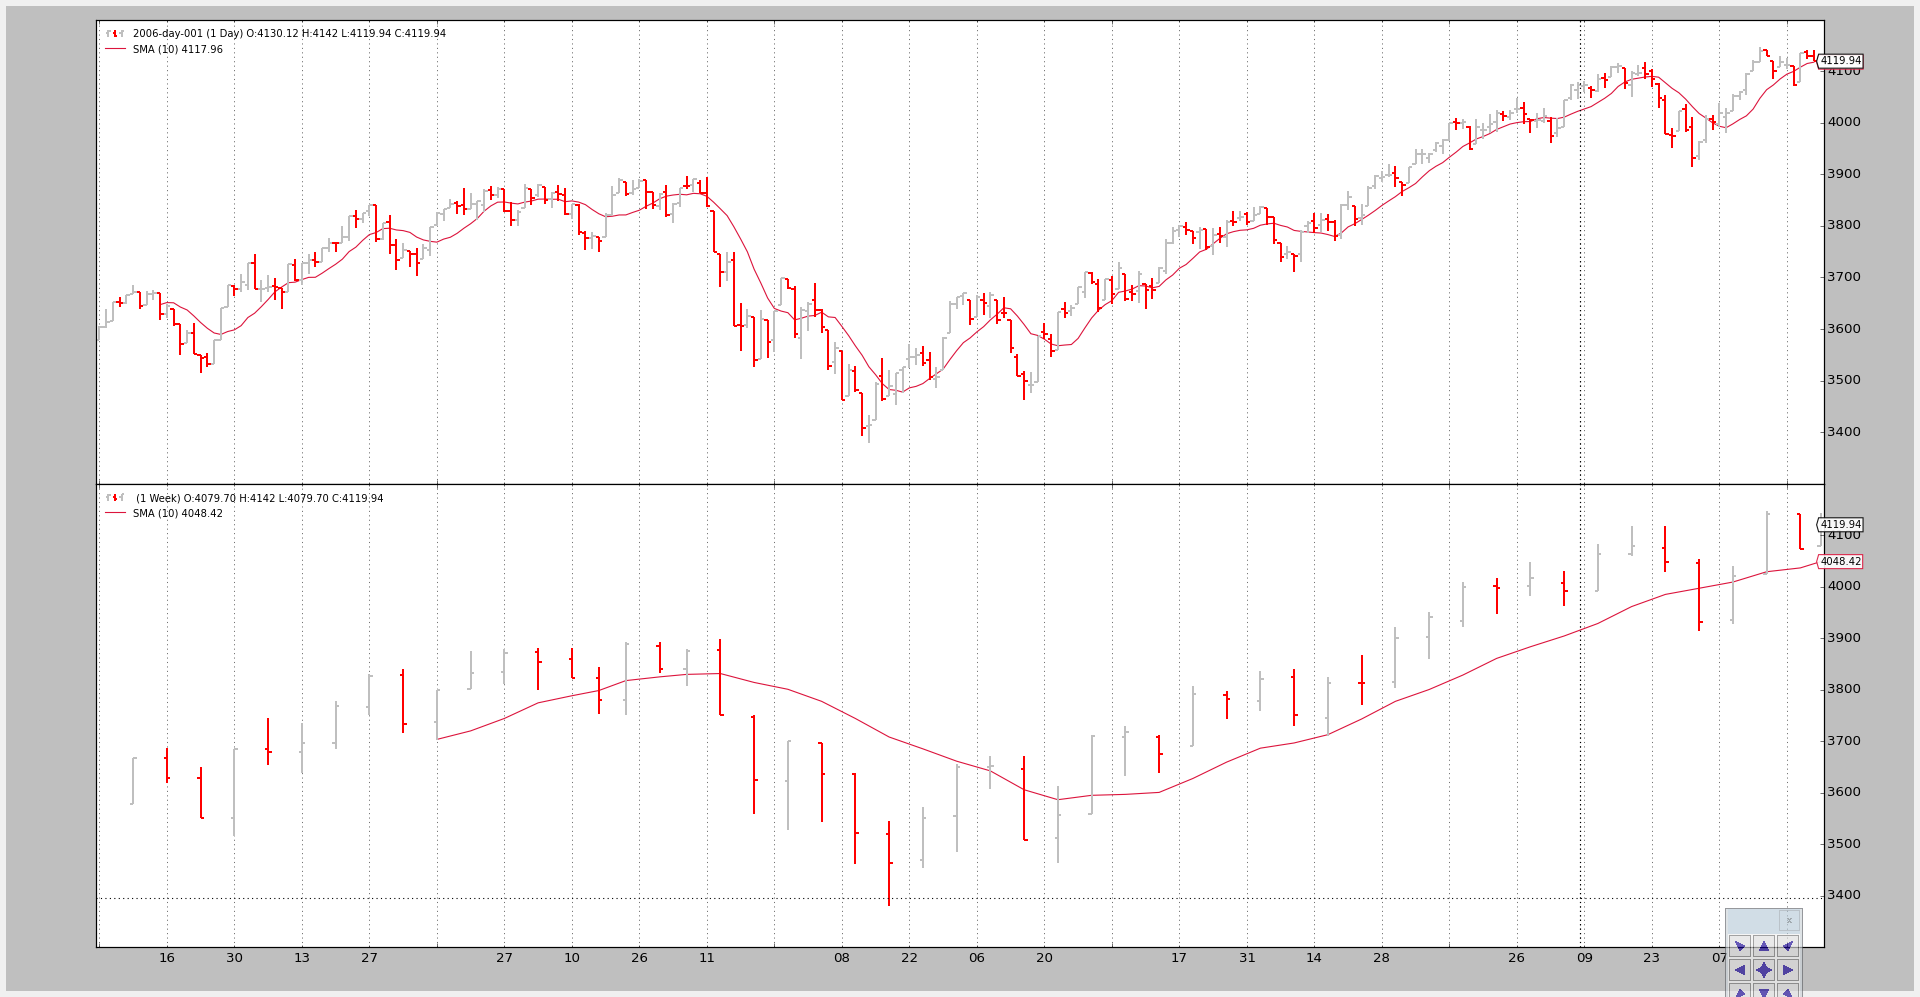
Invocation 2:
Both timeframes get a Simple Moving Average
The command line:
$ ./multitimeframe-example.py --timeframe weekly --compression 1 --indicators
--------------------------------------------------
nextstart called with len 50
--------------------------------------------------
--------------------------------------------------
nextstart called with len 51
--------------------------------------------------
--------------------------------------------------
nextstart called with len 52
--------------------------------------------------
--------------------------------------------------
nextstart called with len 53
--------------------------------------------------
--------------------------------------------------
nextstart called with len 54
--------------------------------------------------
Two things to notice here:
这里需要注意两件事:
-
Instead of being called after 10 periods, the strategy is 1st called after 50 periods.
- 策略不是在10个周期之后调用,而是在50个周期之后第一次调用。
-
It is so because the Simple Moving Average applied on the larger (weekly) timeframe produces a value after 10 weeks … and that is
10 weeks * 5 days / week … 50 days - 之所以如此,是因为应用于较大(周)时间框架的简单移动平均线在10周后会产生一个值,即10周* 5天/周…50天
-
nextstartgets called 5 times rather than only 1. - nextstart被调用5次,而不是只有1次。
-
This is a natural side effect of having mixed the timeframe and having (in this case only one) indicators applied to the larger timeframe.
- 这是混合时间框架和应用于更大时间框架的指标(在本例中只有一个)的自然副作用。
-
The larger timeframe Simple Moving Average produces 5 times the same value whilst 5 daily bars are being consumed.
- 更大的时间框架简单移动平均线产生5倍的相同的价值,而5条每天被消耗。
-
And because the start of the period is being controlled by the larger timeframe
nextstartgets called 5 times. - 因为周期的开始是由更大的时间框架控制的,所以nextstart被调用5次。
- 读取数据帧的时候,还是按照小的数据帧读取,len(self)也是小的数据帧
And the chart.
还有就是当开始画SMA之后--compression参数就失效了,实例代码中的图也有问题,我这里compression参数变大,大周期的周期就变大了,但案例中是变小
Conclusion
Multiple Timeframe Datas can be used in backtrader with no special objects or tweaking: just add the smaller timeframes first.
The test script.
from __future__ import (absolute_import, division, print_function,
                        unicode_literals)

import argparse

import backtrader as bt
import backtrader.feeds as btfeeds
import backtrader.indicators as btind


class SMAStrategy(bt.Strategy):
    params = (
        ('period', 10),
        ('onlydaily', False),
    )

    def __init__(self):
        self.sma_small_tf = btind.SMA(self.data, period=self.p.period)
        if not self.p.onlydaily:
            self.sma_large_tf = btind.SMA(self.data1, period=self.p.period)

    def nextstart(self):
        print('--------------------------------------------------')
        print('nextstart called with len', len(self))
        print('--------------------------------------------------')

        super(SMAStrategy, self).nextstart()


def runstrat():
    args = parse_args()

    # Create a cerebro entity
    cerebro = bt.Cerebro(stdstats=False)

    # Add a strategy
    if not args.indicators:
        cerebro.addstrategy(bt.Strategy)
    else:
        cerebro.addstrategy(
            SMAStrategy,

            # args for the strategy
            period=args.period,
            onlydaily=args.onlydaily,
        )

    # Load the Data
    datapath = args.dataname or '../../datas/2006-day-001.txt'
    data = btfeeds.BacktraderCSVData(dataname=datapath)
    cerebro.adddata(data)  # First add the original data - smaller timeframe

    tframes = dict(daily=bt.TimeFrame.Days, weekly=bt.TimeFrame.Weeks,
                   monthly=bt.TimeFrame.Months)

    # Handy dictionary for the argument timeframe conversion
    # Resample the data
    if args.noresample:
        datapath = args.dataname2 or '../../datas/2006-week-001.txt'
        data2 = btfeeds.BacktraderCSVData(dataname=datapath)
        # And then the large timeframe
        cerebro.adddata(data2)
    else:
        cerebro.resampledata(data, timeframe=tframes[args.timeframe],
                             compression=args.compression)

    # Run over everything
    cerebro.run()

    # Plot the result
    cerebro.plot(style='bar')


def parse_args():
    parser = argparse.ArgumentParser(
        description='Multitimeframe test')

    parser.add_argument('--dataname', default='', required=False,
                        help='File Data to Load')

    parser.add_argument('--dataname2', default='', required=False,
                        help='Larger timeframe file to load')

    parser.add_argument('--noresample', action='store_true',
                        help='Do not resample, rather load larger timeframe')

    parser.add_argument('--timeframe', default='weekly', required=False,
                        choices=['daily', 'weekly', 'monhtly'],
                        help='Timeframe to resample to')

    parser.add_argument('--compression', default=1, required=False, type=int,
                        help='Compress n bars into 1')

    parser.add_argument('--indicators', action='store_true',
                        help='Wether to apply Strategy with indicators')

    parser.add_argument('--onlydaily', action='store_true',
                        help='Indicator only to be applied to daily timeframe')

    parser.add_argument('--period', default=10, required=False, type=int,
                        help='Period to apply to indicator')

    return parser.parse_args()


if __name__ == '__main__':
    runstrat()
总结:数据可以直接进去两个不同的时间序列,系统会自动按照最小序列进行读取。
可以通过cerebro.resampledata的方法,重采样原始数据,在输入数据中会多一份self.data1。
示例中重采样用的是读取csv文件,后续如果采用自定义的数据能否重采样未知。
