

echarts 地图设置背景图片、海岸线

1、地图设置背景图片
1 2 3 4 5 6 7 8 9 10 11 12 13 14 15 16 | // datadomImg: require('@/assets/images/largescreen/nation/map_bg.png'), // js 渲染地图之前var domImg = document.createElement("img");domImg.style.height = domImg.height = domImg.width = domImg.style.width = "100px";domImg.src = that.domImg; // js 渲染地址时,在地图配置项geo中itemStylenormal: { areaColor: { type: "pattern", image: domImg, //配置图片 repeat: "repeat", //可选值repeat、no-repeat、repeat-x、repeat-y },} |
2、地图外部多层轮廓线
首先来看单层加粗外边框,其实很简单。咱们看一下效果
1 2 3 4 5 6 7 8 9 10 11 | // 在地图配置项series中添加样式,效果如下图itemStyle: { normal: { areaColor: '#3075b2', borderColor: '#4c99f9', borderWidth: 1 }, emphasis: { areaColor: '#01215c' }} |

1 2 3 4 5 6 7 8 | // 在地图的配置项geo中设置,效果如下图itemStyle: { normal: { areaColor: '#01215c', borderWidth: 5,//设置外层边框 borderColor:'#9ffcff', }} |
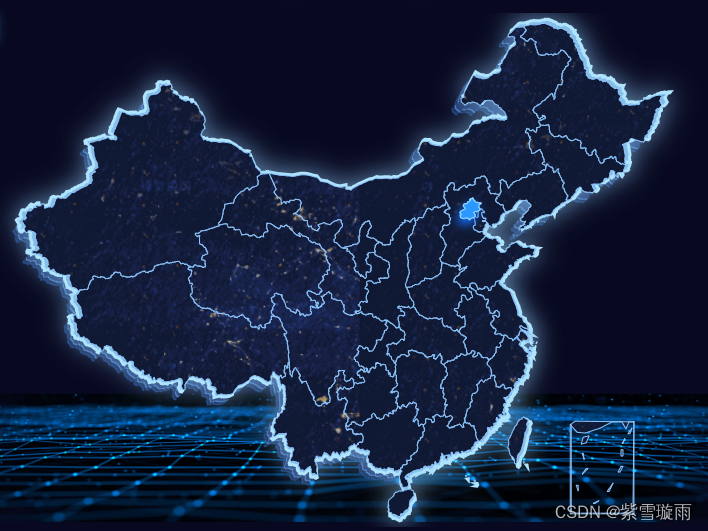
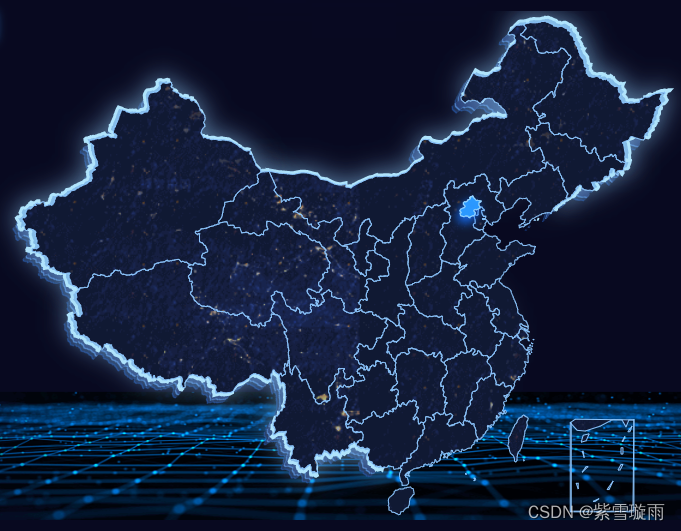
在地图配置项series、geo中设置边框,单独设置就是上图所示。一起设置如下图,中间边框细,外轮廓边框粗的效果。
外轮廓加投影就是在 geo中添加 shadowColor设置,以及偏移shadowOffsetX、shadowOffsetY、shadowBlur。
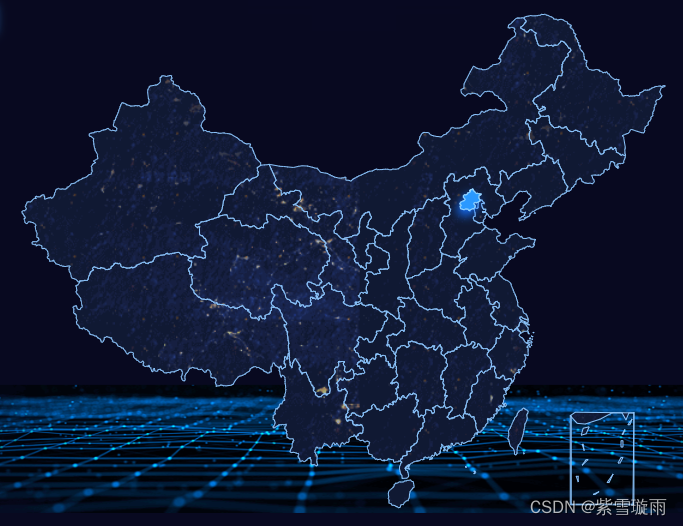
如果想要多层外轮廓,就是在geo设置多个对象。
1 2 3 4 5 6 7 8 9 10 11 12 13 14 15 16 17 18 19 20 21 22 23 24 25 26 27 28 29 30 31 32 33 34 35 36 37 38 39 40 41 42 43 44 45 46 47 48 49 50 51 52 53 54 55 56 57 58 59 60 61 62 63 64 65 66 67 68 69 70 71 72 73 74 75 76 77 78 79 80 81 82 83 84 85 86 87 88 89 90 91 92 93 94 95 96 97 98 99 | // 通过偏移,缩放来实现多层外轮廓的效果this.option.geo = [ { // 主图 map: map, zlevel: 0, zoom: 1.2, //当前视角的缩放比例 roam: false, //是否开启平游或缩放 center: undefined, show: true, label: { normal: { show: false, }, emphasis: { show: false, }, }, itemStyle: { normal: { borderColor: "rgba(141, 199, 255,1)", borderWidth: 1, areaColor: { type: "pattern", image: domImg, //配置图片 repeat: "repeat", //可选值repeat、no-repeat、repeat-x、repeat-y }, }, emphasis: { areaColor: "#2d9eff", //悬浮区背景 shadowColor: "rgba(20, 113, 255,1)", shadowOffsetX: -2, shadowOffsetY: 5, shadowBlur: 10, }, }, }, //第一层投影 { map: map, zlevel: -1, zoom: 1.22, //当前视角的缩放比例 roam: false, //是否开启平游或缩放 center: undefined, show: true, label: { normal: { show: false, }, emphasis: { show: false, }, }, itemStyle: { normal: { borderJoin: "round", borderColor: "rgba(176,228,252,1)", borderWidth: 3, areaColor: "rgba(133,188,232,1)", shadowColor: "rgba(133,188,232,.7)", shadowOffsetX: 0, shadowOffsetY: 0, shadowBlur: 25, }, emphasis: { show: false, }, }, }, // 第二层投影 { map: map, zlevel: -2, zoom: 1.2, //当前视角的缩放比例 roam: false, //是否开启平游或缩放 center: undefined, show: true, label: { normal: { show: false, }, emphasis: { show: false, }, }, itemStyle: { normal: { borderJoin: "round", areaColor: "rgba(30,49,105,1)", shadowColor: "rgba(30,49,105,1)", shadowOffsetX: -5, shadowOffsetY: 6, }, emphasis: { show: false, }, }, },} |
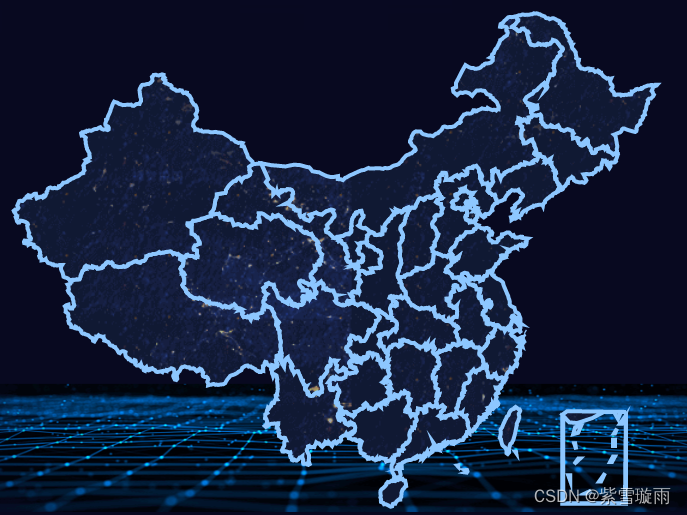
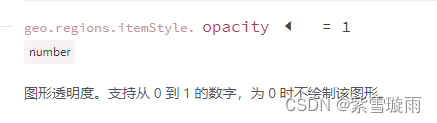
在echarts中regions是对特定的区域配置样式,opacity中0的时候不会绘制该图形,所以根据regions配置项来清除一部分图形。这样一来,直接在一个map上是不能实现海岸线效果的。那就需要两个div地图来实现海岸线效果。一层map是顶层的,完整数据的地图,一层是去掉海岸想相关数据的地图层。
1 2 3 4 5 6 7 8 9 10 11 12 13 14 15 16 17 18 19 20 21 22 23 24 25 26 27 28 29 30 | // 首先把一部分图形隐藏regionsOption:[ { name: "北京市", itemStyle: { // 隐藏地图 normal: { opacity: 0, // 为 0 时不绘制该图形 } }, label: { show: false // 隐藏文字 } }, ...... { name: "南海诸岛", itemStyle: { // 隐藏地图 normal: { opacity: 0, // 为 0 时不绘制该图形 } }, label: { show: false // 隐藏文字 } }, ] |
完整的地图数据我是从DataV.GeoAtlas下载的。
对某些省份图形的隐藏之后,发现,辽宁、广西在海岸线中只占一部分,就不能根据隐藏图形来实现了。但是可以修改地图绘制的经纬度,把辽宁、广西的一部分经纬度绘制去掉就可以得到下图效果。 下载海岸线除去辽宁广西部分经纬度json数据
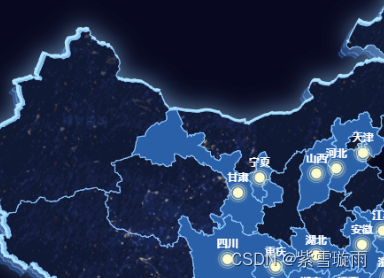
4、地图中高亮显示有数据的城市
数据高亮显示,在地图配置项series中data中设置itemStyle.areaColor。还可以加scatter,effectScatter都可以,根据需求来定。
1 2 3 4 5 6 7 8 9 10 11 12 13 14 15 16 17 18 19 20 21 22 23 24 25 26 27 28 29 30 31 32 33 34 35 36 37 38 39 40 41 | // series-map.data.itemStyle地图数据高亮显示var data = [ { name: '天津', value: 4075, itemStyle: {areaColor: '#faa'} }, { name: '湖北', value: 500, itemStyle: {areaColor: '#faa'} }]; // series-effectScatter带有涟漪特效动画的散点(气泡)图// this.convertData() 的数据格式:根据获取地图的数据,筛选出和data对应的数据,格式:[{name: 'name', value: 'value'}]{ type: "effectScatter", coordinateSystem: "geo", data: this.convertData(), // geoIndex:1, symbolSize: function (val) { return 10; }, showEffectOn: "render", rippleEffect: { brushType: "stroke", }, hoverAnimation: true, label: { normal: { formatter: "{b}", position: "top", show: true, color: "#fff", fontSize: 10, fontWeight: 800, }, }, itemStyle: { normal: { color: "#fdfbcc", shadowBlur: 10, shadowColor: "#fdfbcc", }, }, zlevel: 1, }, |
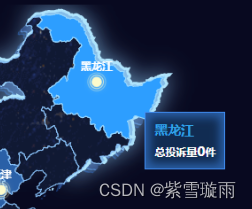
5、滚动高亮轮播
根据dispatchAction来设置地图的配置项,和定时器相结合来实现滚动高亮显示
1 2 3 4 5 6 7 8 9 10 11 12 13 14 15 16 17 18 19 20 21 22 23 24 25 26 27 28 29 30 31 32 33 34 35 36 37 38 39 40 41 42 43 44 45 46 47 48 49 50 51 | // 设置鼠标移入移出地图以及点击地图mounted() { this.$nextTick(() => { this.initEcharts(); let that = this; this.chart.on("click", this.echartsMapClick); this.chart.on("mouseover", this.echartsMapMouseover); this.chart.on("mouseout", this.echartsMapMouseout); })} // 地图鼠标移入事件 echartsMapMouseover() { clearInterval(this.tooltipAutoplay); }, // 地图鼠标移出事件 echartsMapMouseout() { this.setTooltipAutoplay(); }, // 动态显示tooltip setTooltipAutoplay() { clearInterval(this.tooltipAutoplay); var index = 0; //播放所在下标 var itemIndexList = new Array(this.mapDataList.length); //固定数组长度为3 for (var i = 0; i < itemIndexList.length; i++) { itemIndexList[i] = i; } this.tooltipAutoplay = setInterval(() => { this.chart.dispatchAction({ type: "downplay", seriesIndex: 0, dataIndex: itemIndexList, }); this.chart.dispatchAction({ type: "showTip", seriesIndex: 0, dataIndex: this.tooltipAutoplayIndex, }); this.chart.dispatchAction({ type: "highlight", seriesIndex: 0, dataIndex: this.tooltipAutoplayIndex, }); this.tooltipAutoplayIndex++; if (this.tooltipAutoplayIndex >= this.mapDataList.length) { this.tooltipAutoplayIndex = 0; this.setTooltipAutoplay(); } }, 6666); }, |


【推荐】国内首个AI IDE,深度理解中文开发场景,立即下载体验Trae
【推荐】编程新体验,更懂你的AI,立即体验豆包MarsCode编程助手
【推荐】抖音旗下AI助手豆包,你的智能百科全书,全免费不限次数
【推荐】轻量又高性能的 SSH 工具 IShell:AI 加持,快人一步
· winform 绘制太阳,地球,月球 运作规律
· 超详细:普通电脑也行Windows部署deepseek R1训练数据并当服务器共享给他人
· TypeScript + Deepseek 打造卜卦网站:技术与玄学的结合
· AI 智能体引爆开源社区「GitHub 热点速览」
· 写一个简单的SQL生成工具