

二进制部署 Prometheus+Alertmanager+Grafana
从官网手动安装
- Prometheus 采集、存储数据
- Grafana 用于图表展示
- alertmanager 用于接收 Prometheus 发送的告警信息
- node-exporter 用于收集操作系统和硬件信息的metrics
二进制部署
#切换到root用户 sudo -i #创建一个专门的 prometheus 用户: useradd -M -s /usr/sbin/nologin prometheus #更改 prometheus 用户的文件夹权限: chown prometheus:prometheus -R /opt/prometheus #下载prometheus二进制压缩包 wget https://github.com/prometheus/prometheus/releases/download/v2.37.6/prometheus- 2.37.6.linux-amd64.tar.gz #解压 tar xf prometheus-2.37.6.linux-amd64.tar.gz #查看解压后的文件名 ls -l mkdir /opt/prometheus -p #移动解压后的文件名到/opt/,并改名prometheus mv prometheus-2.37.6.linux-amd64/ /opt/prometheus/prometheus #创建 systemd 服务 cat > /etc/systemd/system/prometheus.service << "EOF" [Unit] Description=Prometheus Server Documentation=https://prometheus.io/docs/introduction/overview/ After=network-online.target [Service] Type=simple User=prometheus Group=prometheus Restart=on-failure ExecStart=/opt/prometheus/prometheus/prometheus \ --config.file=/opt/prometheus/prometheus/prometheus.yml \ --storage.tsdb.path=/opt/prometheus/prometheus/data \ --storage.tsdb.retention.time=60d \ --web.enable-lifecycle [Install] WantedBy=multi-user.target EOF
配置参数解释:
通过 /opt/prometheus/prometheus -h 查看帮助详情
--config.file=/opt/prometheus/prometheus/prometheus.yml #主配置文件 --storage.tsdb.path=/opt/prometheus/prometheus/data #数据库存储目 录 --web.console.libraries=/opt/prometheus/prometheus/console_libraries #指定控制台库 目录路径 --web.console.templates=/opt/prometheus/prometheus/consoles #指定控制台模 版目录路径 --storage.tsdb.retention=60d #指明数据保留 天数,默认15天 --web.enable-lifecycle #热加载
启动 Prometheus
systemctl daemon-reload systemctl start prometheus.service systemctl enable prometheus.service systemctl status prometheus.service
查看 Prometheus 的日志以进行故障排除:
journalctl -u prometheus.service -f
| 应用 | 访问地址 | 备注 |
|---|---|---|
| prometheus | http://192.168.61.30:9090 | 无用户和密 |
安装alertmanager
下载alertmanager二进制压缩包 wget https://github.com/prometheus/alertmanager/releases/download/v0.25.0/alertmanager- 0.25.0.linux-amd64.tar.gz #解压 tar xf alertmanager-0.25.0.linux-amd64.tar.gz #查看解压后的文件名 ls -l #移动解压后的文件名到/opt/,并改名为alertmanager mv alertmanager-0.25.0.linux-amd64 /opt/prometheus/alertmanager
更改 alertmanager 文件夹权限:
chown prometheus:prometheus -R /opt/prometheus/alertmanager
创建 systemd 服务
cat >/etc/systemd/system/alertmanager.service << "EOF" [Unit] Description=Alert Manager Wants=network-online.target After=network-online.target [Service] Type=simple User=prometheus Group=prometheus ExecStart=/opt/prometheus/alertmanager/alertmanager \ --config.file=/opt/prometheus/alertmanager/alertmanager.yml \ --storage.path=/opt/prometheus/alertmanager/data Restart=always [Install] WantedBy=multi-user.target EOF
启动 alertmanager
systemctl daemon-reload systemctl start alertmanager.service systemctl enable alertmanager.service systemctl status alertmanager.service
修改prometheus配置
加入alertmanager
vim /opt/prometheus/prometheus/prometheus.yml alerting: alertmanagers: - static_configs: - targets: #根据实际填写alertmanager的地址 - localhost:9093 应用 访问地址 备注 alertmanager http://192.168.11.61:9093 无用户和密码 增加触发器配置文件 检查配置 重启prometheus或重新加载配置文件(二选一) 访问地址 检查 rule_files: #根据实际名修改文件名 - "alert.yml" # 搜刮配置 scrape_configs: - job_name: 'alertmanager' scrape_interval: 15s static_configs: - targets: ['alertmanager:9093']
增加触发器配置文件
cat > /opt/prometheus/prometheus/alert.yml <<"EOF" groups: - name: Prometheus alert rules: # 对任何实例超过30秒无法联系的情况发出警报 - alert: 服务告警 expr: up == 0 for: 30s labels: severity: critical annotations: summary: "服务异常,实例:{{ $labels.instance }}" description: "{{ $labels.job }} 服务已关闭" EOF
检查配置
cd /opt/prometheus/prometheus/
./promtool check config prometheus.yml
重启prometheus或重新加载配置文件(二选一)
#重启 systemctl restart prometheus 或: #重载,需要--web.enable-lifecycle配置 curl -X POST http://localhost:9090/-/reload
| 应用 | 访问地址 | 备注 |
|---|---|---|
| alertmanager | http://192.168.61.30:9093 | 无用户和密 |
二进制安装grafana
cd ~ wget https://dl.grafana.com/enterprise/release/grafana-enterprise-9.4.3.linuxamd64.tar.gz tar -zxvf grafana-enterprise-9.4.3.linux-amd64.tar.gz ls -l mv grafana-9.4.3/ /opt/prometheus/grafana
更改 grafana 文件夹权限:
chown prometheus:prometheus -R /opt/prometheus
创建 systemd 服务
cat >/etc/systemd/system/grafana-server.service<<"EOF" [Unit] Description=Grafana server Documentation=http://docs.grafana.org [Service] Type=simple User=prometheus Group=prometheus Restart=on-failure ExecStart=/opt/prometheus/grafana/bin/grafana-server \ --config=/opt/prometheus/grafana/conf/defaults.ini \ --homepath=/opt/prometheus/grafana [Install] WantedBy=multi-user.target EOF
启动服务
systemctl daemon-reload systemctl start grafana-server.service systemctl enable grafana-server.service systemctl status grafana-server.service
检查日志
journalctl -u grafana-server.service -f
web访问地址
| 应用 | 访问地址 | 备注 |
|---|---|---|
| grafana | 192.168.61.30:3000 | admin/admin |
安装node_exporter
wget https://github.com/prometheus/node_exporter/releases/download/v1.5.0/node_exporter- 1.5.0.linux-amd64.tar.gz tar xvf node_exporter-1.5.0.linux-amd64.tar.gz ls -l mv node_exporter-1.5.0.linux-amd64 /opt/prometheus/node_exporter
更改 node_exporter 文件夹权限:
chown prometheus:prometheus -R /opt/prometheus/node_exporter
创建 systemd 服务
cat > /etc/systemd/system/node_exporter.service <<"EOF" [Unit] Description=node_exporter Documentation=https://prometheus.io/ After=network.target [Service] User=prometheus Group=prometheus ExecStart=/opt/prometheus/node_exporter/node_exporter Restart=on-failure [Install] WantedBy=multi-user.target EOF
启动 node_exporter
systemctl daemon-reload systemctl start node_exporter.service systemctl enable node_exporter.service systemctl status node_exporter.service
检查日志
journalctl -u node_exporter.service -f
web访问地址
| 应用 | 访问地址 | 备注 |
|---|---|---|
| node-exporter | http://192.168.61.30:9100/metrics | 无用户和密码 |
修改prometheus配置
prometheus服务器操作
cat >> /opt/prometheus/prometheus/prometheus.yml <<"EOF" # 再scrape_configs这行下面添加如下配置: #node-exporter配置 - job_name: 'node-exporter' scrape_interval: 15s static_configs: - targets: ['localhost:9100'] labels: instance: Prometheus服务器 EOF
重载prometheus
curl -X POST http://localhost:9090/-/reload
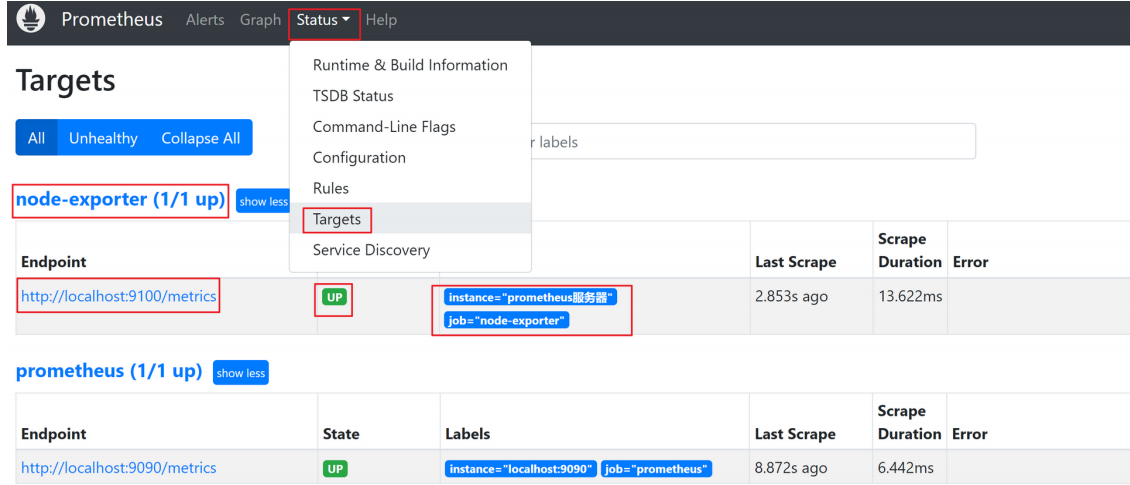
Prometheus web上检查
http://192.168.61.30:9090/
https://grafana.com/grafana/dashboards/
快速部署
cd /opt git clone https://gitee.com/linge365/prometheus.git cd prometheus #移动systemd 服务到/etc/systemd/system/目录下 mv *.service /etc/systemd/system/ #检查 ls -l /etc/systemd/system/ useradd -M -s /usr/sbin/nologin prometheus chown prometheus:prometheus -R /opt/prometheus systemctl daemon-reload #启动服务 systemctl start prometheus.service systemctl start grafana-server.service systemctl start node_exporter.service systemctl start alertmanager.service #开机启动 systemctl enable prometheus.service systemctl enable grafana-server.service systemctl enable node_exporter.service systemctl enable alertmanager.service #检查 systemctl status node_exporter.service systemctl status prometheus.service systemctl status grafana-server.service systemctl status alertmanager.service
作者:一毛
本博客所有文章仅用于学习、研究和交流目的,欢迎非商业性质转载。
不管遇到了什么烦心事,都不要自己为难自己;无论今天发生多么糟糕的事,都不应该感到悲伤。记住一句话:越努力,越幸运。


【推荐】国内首个AI IDE,深度理解中文开发场景,立即下载体验Trae
【推荐】编程新体验,更懂你的AI,立即体验豆包MarsCode编程助手
【推荐】抖音旗下AI助手豆包,你的智能百科全书,全免费不限次数
【推荐】轻量又高性能的 SSH 工具 IShell:AI 加持,快人一步
· 无需6万激活码!GitHub神秘组织3小时极速复刻Manus,手把手教你使用OpenManus搭建本
· C#/.NET/.NET Core优秀项目和框架2025年2月简报
· 葡萄城 AI 搜索升级:DeepSeek 加持,客户体验更智能
· 什么是nginx的强缓存和协商缓存
· 一文读懂知识蒸馏
2020-03-14 Ansible-Playbook基础