ggplot2: how to check the color and coreponding value pairs
The way to check the color and coreponding value pairs in ggplot2
To see what colors are used to make your plot you can use function ggplot_build() and then look at data part of this object (in column colour are codes).
p <- ggplot(df, aes(x = value, y = value, color = type)) +
    geom_point(shape = 21, size = 4)

ggplot_build(p)$data
# [[1]]
#    colour x y PANEL group
# 1 #F8766D 1 1     1     1
# 2 #B79F00 2 2     1     2
# 3 #00BA38 3 3     1     3
# 4 #00BFC4 4 4     1     4
# 5 #619CFF 5 5     1     5
# 6 #F564E3 6 6     1     6
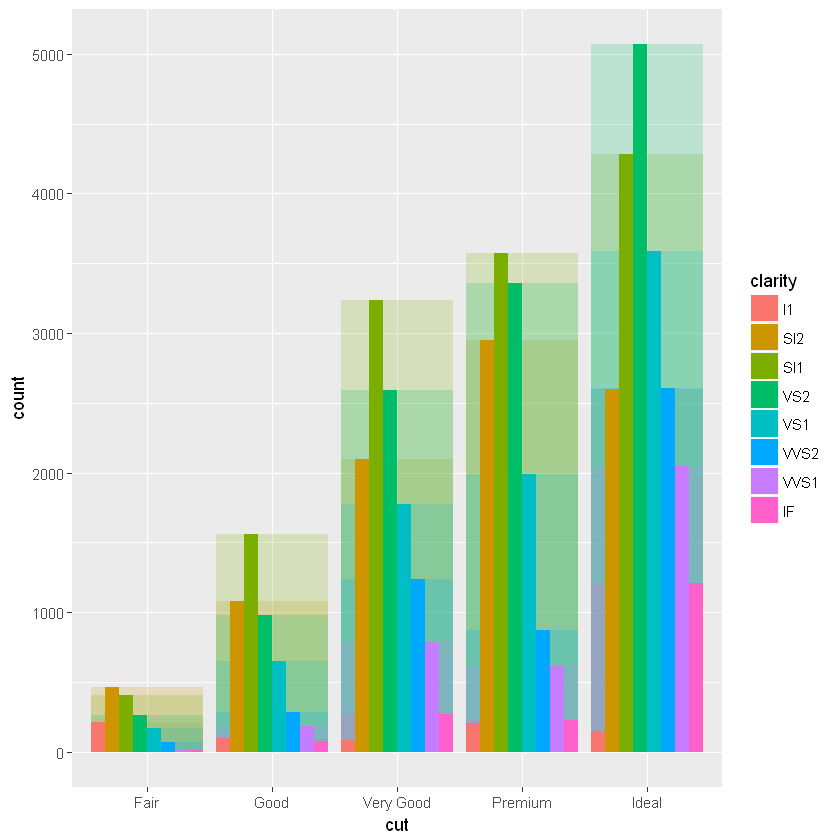
ggplot2 position parameter usage :
ggplot(data = diamonds + geom_bar(mapping = aes(x = cut, fill = clarity),
             position = "identity",alpha = 1/5) +
             geom_bar(aes(x = cut, fill = clarity), position = "dodge")