
图解大数据 | Spark机器学习(下)—建模与超参调优
 本文介绍Spark中用于大数据机器学习的板块MLlib/ML,讲解分类算法、回归算法、聚类算法和PCA降维算法的代码实践,并讲解超参数调优和交叉验证、训练集验证集切分等重要知识点。

作者:韩信子@ShowMeAI
教程地址:https://www.showmeai.tech/tutorials/84
本文地址:https://www.showmeai.tech/article-detail/181
声明:版权所有,转载请联系平台与作者并注明出处
1.分类、回归与聚类模型
1)分类算法概述
分类是一种重要的机器学习和数据挖掘技术。分类的目的是根据数据集的特点构造一个分类函数或分类模型(也常常称作分类器),该模型能把未知类别的样本映射到给定类别中的一种技术。
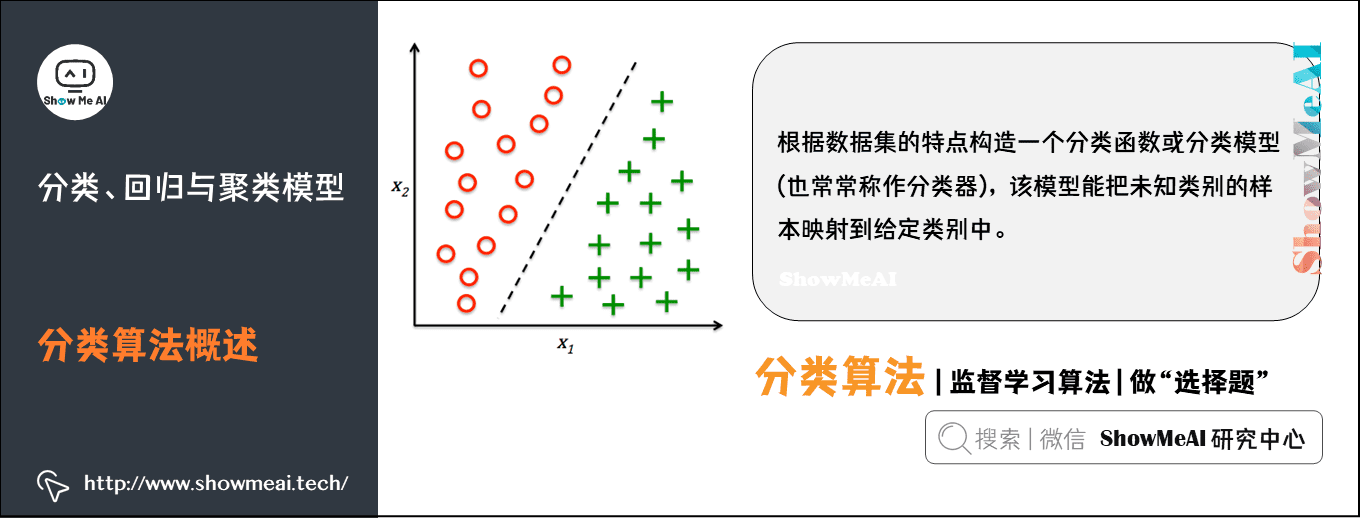
分类的目的就是分析输入数据,通过在训练集中的数据表现出来的特性,为每一个类找到一种准确的描述或者模型,采用该种方法(模型)将隐含函数表示出来。
构造分类模型的过程一般分为训练和测试两个阶段。
- 在构造模型之前,将数据集随机地分为训练数据集和测试数据集。
- 先使用训练数据集来构造分类模型,然后使用测试数据集来评估模型的分类准确率。
- 如果认为模型的准确率可以接受,就可以用该模型对其它数据元组进分类。
一般来说,测试阶段的代价远低于训练阶段。
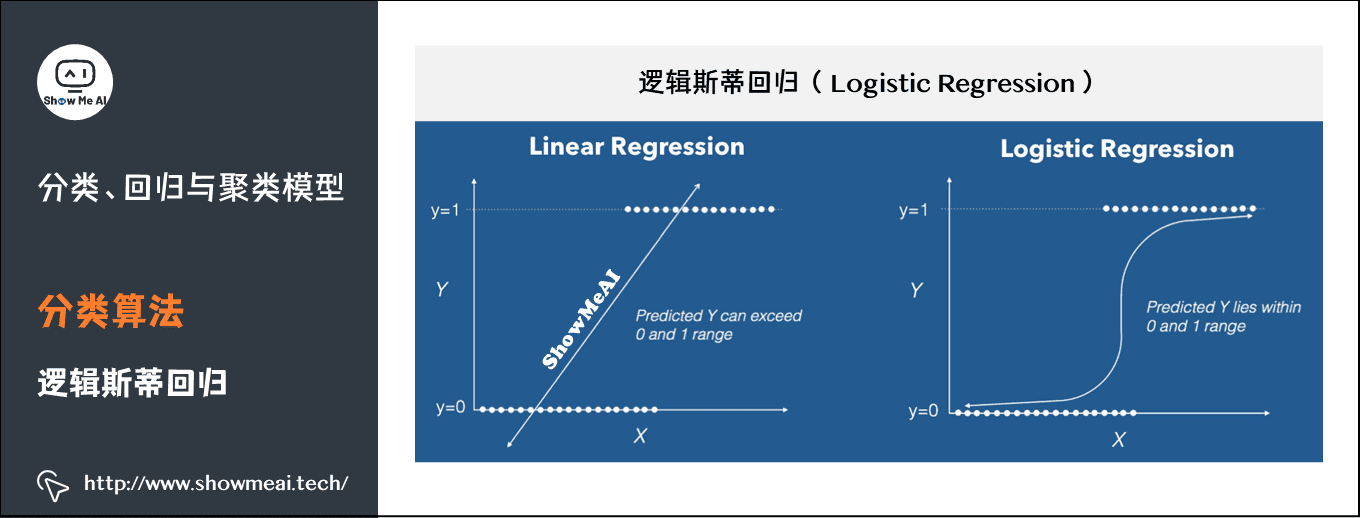
(1)逻辑回归
逻辑回归(logistic regression)是统计学习中的经典分类方法,属于对数线性模型。logistic回归的因变量可以是二分类的,也可以是多分类的。
- 获取数据集与代码 → ShowMeAI的官方GitHub https://github.com/ShowMeAI-Hub/awesome-AI-cheatsheets
- 运行代码段与学习 → 在线编程环境 http://blog.showmeai.tech/python3-compiler
from pyspark.ml.classification import LogisticRegression from pyspark.sql import SparkSession spark = SparkSession \ .builder \ .appName("LogisticRegressionSummary") \ .getOrCreate() # 加载数据 training = spark.read.format("libsvm").load("data/mllib/sample_libsvm_data.txt") lr = LogisticRegression(maxIter=10, regParam=0.3, elasticNetParam=0.8) # 拟合模型 lrModel = lr.fit(training) # 模型信息总结与输出 trainingSummary = lrModel.summary # 输出每一轮的损失函数值 objectiveHistory = trainingSummary.objectiveHistory print("objectiveHistory:") for objective in objectiveHistory: print(objective) # ROC曲线 trainingSummary.roc.show() print("areaUnderROC: " + str(trainingSummary.areaUnderROC)) spark.stop()
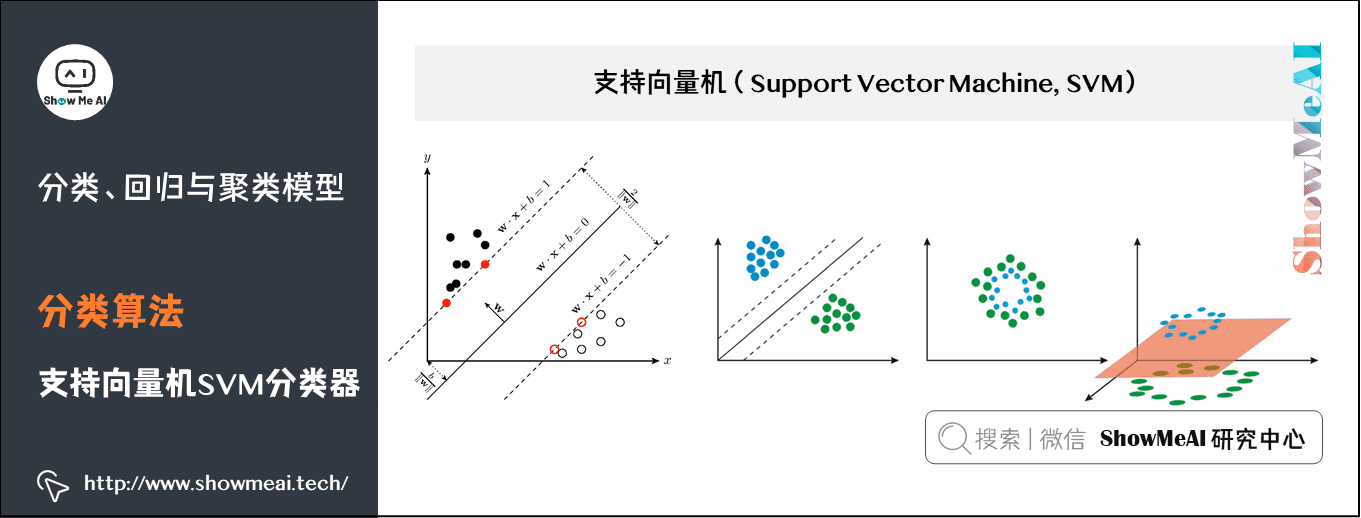
(2)支持向量机SVM分类器
支持向量机SVM是一种二分类模型。它的基本模型是定义在特征空间上的间隔最大的线性分类器。支持向量机学习方法包含3种模型:线性可分支持向量机、线性支持向量机及非线性支持向量机。
- 当训练数据线性可分时,通过硬间隔最大化,学习一个线性的分类器,即线性可分支持向量机;
- 当训练数据近似线性可分时,通过软间隔最大化,也学习一个线性的分类器,即线性支持向量机;
- 当训练数据线性不可分时,通过使用核技巧及软间隔最大化,学习非线性支持向量机。
线性支持向量机支持L1和L2的正则化变型。
- 获取数据集与代码 → ShowMeAI的官方GitHub https://github.com/ShowMeAI-Hub/awesome-AI-cheatsheets
- 运行代码段与学习 → 在线编程环境 http://blog.showmeai.tech/python3-compiler
from pyspark.ml.classification import LinearSVC # Load training data training = spark.read.format("libsvm").load("data/mllib/sample_libsvm_data.txt") lsvc = LinearSVC(maxIter=10, regParam=0.1) # Fit the model lsvcModel = lsvc.fit(training) # Print the coefficients and intercept for linear SVC print("Coefficients: " + str(lsvcModel.coefficients)) print("Intercept: " + str(lsvcModel.intercept))
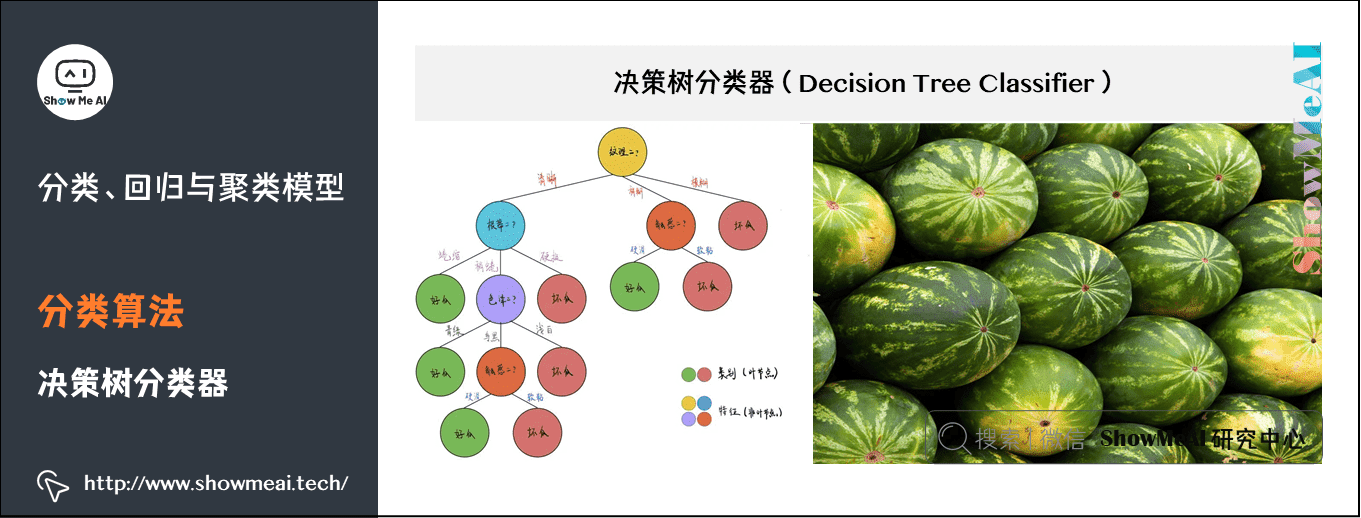
(3)决策树分类器
决策树(decision tree)是一种基本的分类与回归方法,这里主要介绍用于分类的决策树。决策树模式呈树形结构,其中每个内部节点表示一个属性上的测试,每个分支代表一个测试输出,每个叶节点代表一种类别。
学习时利用训练数据,根据损失函数最小化的原则建立决策树模型;预测时,对新的数据,利用决策树模型进行分类。
- 获取数据集与代码 → ShowMeAI的官方GitHub https://github.com/ShowMeAI-Hub/awesome-AI-cheatsheets
- 运行代码段与学习 → 在线编程环境 http://blog.showmeai.tech/python3-compiler
from pyspark.ml import Pipeline from pyspark.ml.classification import DecisionTreeClassifier from pyspark.ml.feature import StringIndexer, VectorIndexer from pyspark.ml.evaluation import MulticlassClassificationEvaluator # Load the data stored in LIBSVM format as a DataFrame. data = spark.read.format("libsvm").load("data/mllib/sample_libsvm_data.txt") # Index labels, adding metadata to the label column. # Fit on whole dataset to include all labels in index. labelIndexer = StringIndexer(inputCol="label", outputCol="indexedLabel").fit(data) # Automatically identify categorical features, and index them. # We specify maxCategories so features with > 4 distinct values are treated as continuous. featureIndexer =\ VectorIndexer(inputCol="features", outputCol="indexedFeatures", maxCategories=4).fit(data) # Split the data into training and test sets (30% held out for testing) (trainingData, testData) = data.randomSplit([0.7, 0.3]) # Train a DecisionTree model. dt = DecisionTreeClassifier(labelCol="indexedLabel", featuresCol="indexedFeatures") # Chain indexers and tree in a Pipeline pipeline = Pipeline(stages=[labelIndexer, featureIndexer, dt]) # Train model. This also runs the indexers. model = pipeline.fit(trainingData) # Make predictions. predictions = model.transform(testData) # Select example rows to display. predictions.select("prediction", "indexedLabel", "features").show(5) # Select (prediction, true label) and compute test error evaluator = MulticlassClassificationEvaluator( labelCol="indexedLabel", predictionCol="prediction", metricName="accuracy") accuracy = evaluator.evaluate(predictions) print("Test Error = %g " % (1.0 - accuracy)) treeModel = model.stages[2] # summary only print(treeModel)
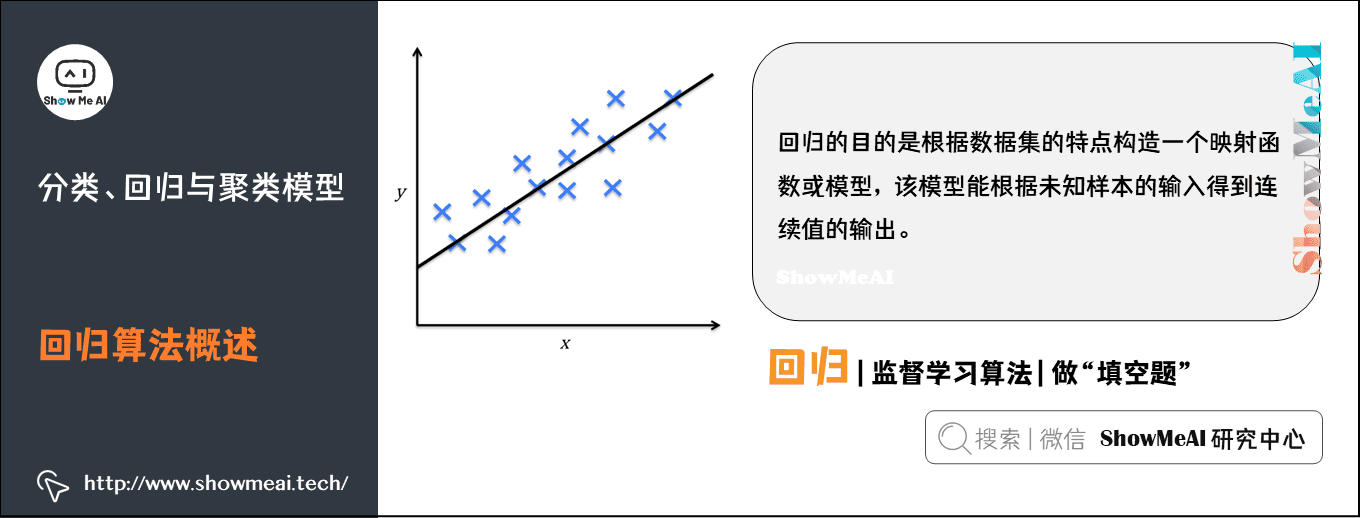
2)回归算法概述
回归也是一种重要的机器学习和数据挖掘技术。回归的目的是根据数据集的特点构造一个映射函数或模型,该模型能根据未知样本的输入得到连续值的输出。
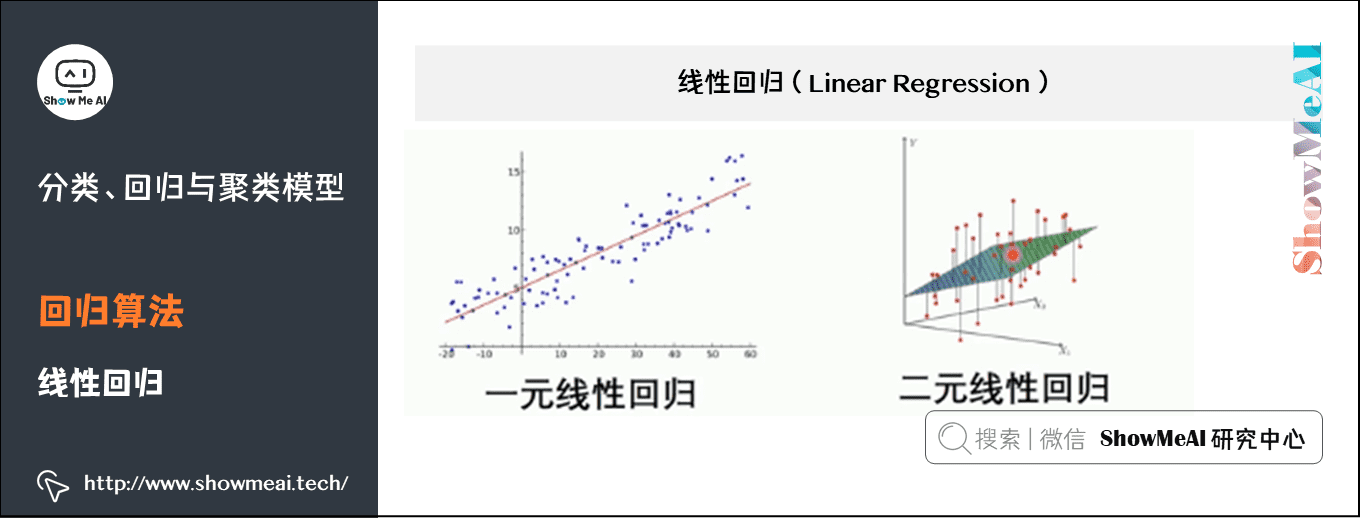
(1)线性回归
线性回归是利用数理统计中回归分析,来确定两种或两种以上变量间相互依赖的定量关系的一种统计分析方法,运用十分广泛。其表达形式为y = w’x+e,e为误差服从均值为0的正态分布。
回归分析中,只包括一个自变量和一个因变量,且二者的关系可用一条直线近似表示,这种回归分析称为一元线性回归分析。
如果回归分析中包括两个或两个以上的自变量,且因变量和自变量之间是线性关系,则称为多元线性回归分析。
- 获取数据集与代码 → ShowMeAI的官方GitHub https://github.com/ShowMeAI-Hub/awesome-AI-cheatsheets
- 运行代码段与学习 → 在线编程环境 http://blog.showmeai.tech/python3-compiler
from pyspark.ml.regression import LinearRegression # Load training data training = spark.read.format("libsvm")\ .load("data/mllib/sample_linear_regression_data.txt") lr = LinearRegression(maxIter=10, regParam=0.3, elasticNetParam=0.8) # Fit the model lrModel = lr.fit(training) # Print the coefficients and intercept for linear regression print("Coefficients: %s" % str(lrModel.coefficients)) print("Intercept: %s" % str(lrModel.intercept)) # Summarize the model over the training set and print out some metrics trainingSummary = lrModel.summary print("numIterations: %d" % trainingSummary.totalIterations) print("objectiveHistory: %s" % str(trainingSummary.objectiveHistory)) trainingSummary.residuals.show() print("RMSE: %f" % trainingSummary.rootMeanSquaredError) print("r2: %f" % trainingSummary.r2)
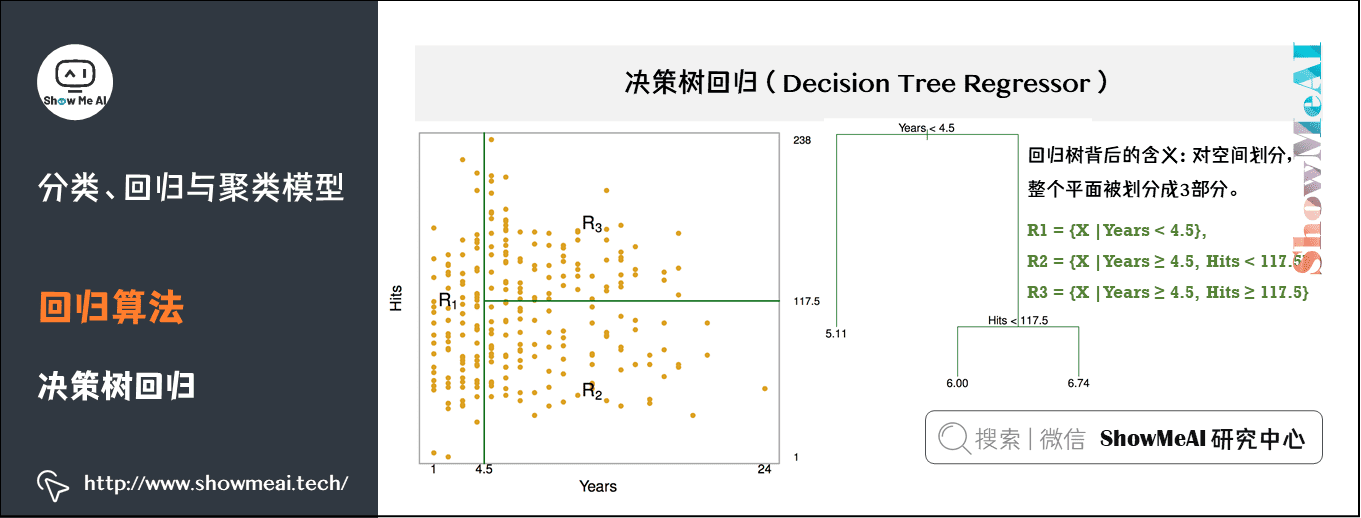
(2)决策树回归
决策树模型既可以求解分类问题(对应的就是 classification tree),也即对应的目标值是类别型数据,也可以应用于回归预测问题的求解(regression tree),其输出值则可以是连续的实数值。
根据从业年限和表现,预估棒球运动员的工资。如图,有1987个数据样本,包含322个棒球运动员。红黄表示高收入,蓝绿表示低收入。横坐标是年限,纵坐标是表现。
- 获取数据集与代码 → ShowMeAI的官方GitHub https://github.com/ShowMeAI-Hub/awesome-AI-cheatsheets
- 运行代码段与学习 → 在线编程环境 http://blog.showmeai.tech/python3-compiler
from pyspark.ml import Pipeline from pyspark.ml.regression import DecisionTreeRegressor from pyspark.ml.feature import VectorIndexer from pyspark.ml.evaluation import RegressionEvaluator from pyspark.sql import SparkSession spark = SparkSession\ .builder\ .appName("DecisionTreeRegressionExample")\ .getOrCreate() # 加载数据 data = spark.read.format("libsvm").load("data/mllib/sample_libsvm_data.txt") # Automatically identify categorical features, and index them. # We specify maxCategories so features with > 4 distinct values are treated as continuous. featureIndexer =\ VectorIndexer(inputCol="features", outputCol="indexedFeatures", maxCategories=4).fit(data) # Split the data into training and test sets (30% held out for testing) (trainingData, testData) = data.randomSplit([0.7, 0.3]) # Train a DecisionTree model. dt = DecisionTreeRegressor(featuresCol="indexedFeatures") # Chain indexer and tree in a Pipeline pipeline = Pipeline(stages=[featureIndexer, dt]) # Train model. This also runs the indexer. model = pipeline.fit(trainingData) # Make predictions. predictions = model.transform(testData) # Select example rows to display. predictions.select("prediction", "label", "features").show(5) # Select (prediction, true label) and compute test error evaluator = RegressionEvaluator( labelCol="label", predictionCol="prediction", metricName="rmse") rmse = evaluator.evaluate(predictions) print("Root Mean Squared Error (RMSE) on test data = %g" % rmse) treeModel = model.stages[1] # summary only print(treeModel) spark.stop()
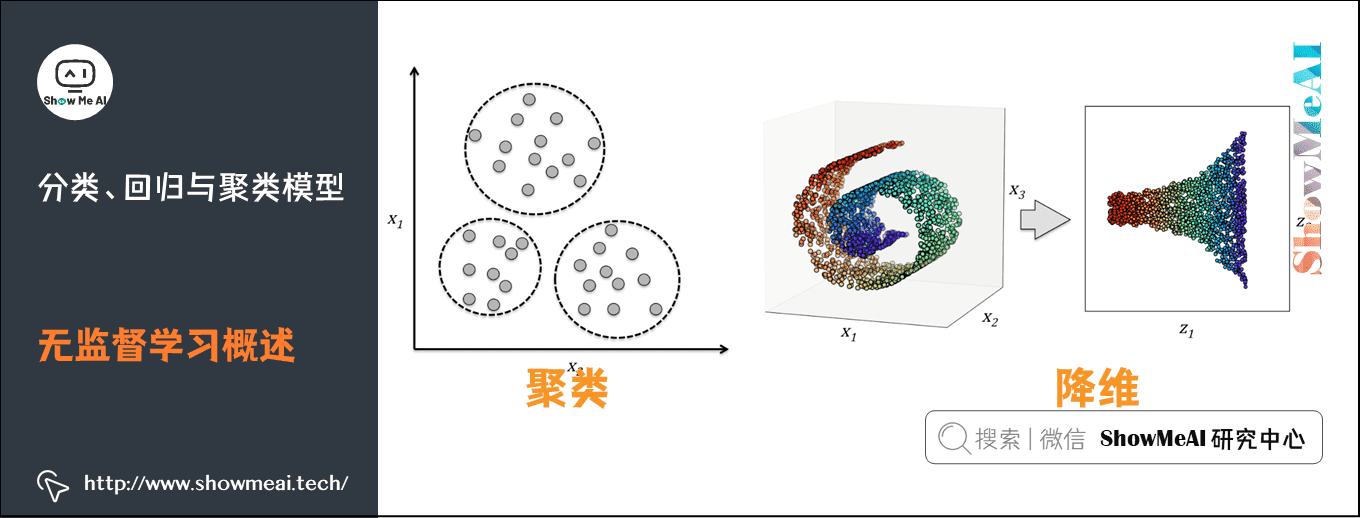
3)无监督学习概述
利用无标签的数据学习数据的分布或数据与数据之间的关系被称为无监督学习。
- 有监督学习和无监督学习的最大区别在于数据是否有标签
- 无监督学习最常应用的场景是聚类(clustering)和降维(Dimension Reduction)
(1)聚类算法
聚类(Clustering) 是机器学习中一类重要的方法。其主要思想使用样本的不同特征属性,根据某一给定的相似度度量方式(如欧式距离)找到相似的样本,并根据距离将样本划分成不同的组。聚类属于典型的无监督学习(Unsupervised Learning) 方法。
与监督学习(如分类器)相比,无监督学习的训练集没有人为标注的结果。在非监督式学习中,数据并不被特别标识,学习模型是为了推断出数据的一些内在结构。
Spark的MLlib库提供了许多可用的聚类方法的实现,如 K-Means、高斯混合模型、Power Iteration Clustering(PIC)、隐狄利克雷分布(LDA) 以及 K-Means 方法的变种 二分K-Means(Bisecting K-Means) 和 流式K-Means(Streaming K-Means)等。
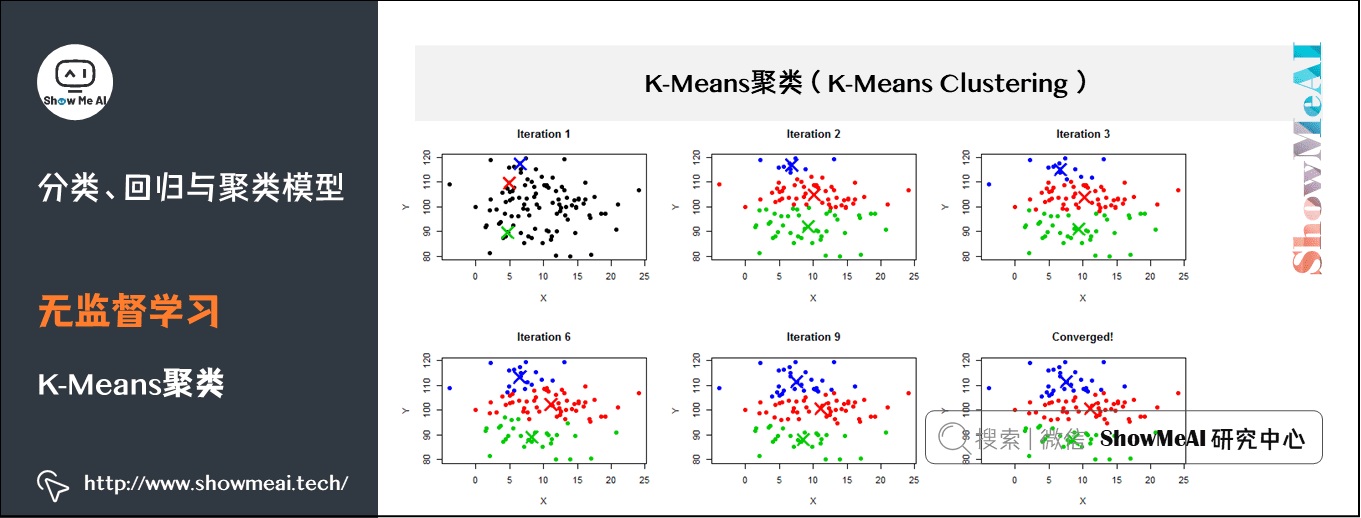
(2)K-Means聚类
K-Means 是一个迭代求解的聚类算法,其属于划分(Partitioning) 型的聚类方法,即首先创建K个划分,然后迭代地将样本从一个划分转移到另一个划分来改善最终聚类的质量,K-Means 的过程大致如下:
- 1.根据给定的k值,选取k个样本点作为初始划分中心;
- 2.计算所有样本点到每一个划分中心的距离,并将所有样本点划分到距离最近的划分中心;
- 3.计算每个划分中样本点的平均值,将其作为新的中心;
- 循环进行2~3步直至达到最大迭代次数,或划分中心的变化小于某一预定义阈值
- 获取数据集与代码 → ShowMeAI的官方GitHub https://github.com/ShowMeAI-Hub/awesome-AI-cheatsheets
- 运行代码段与学习 → 在线编程环境 http://blog.showmeai.tech/python3-compiler
spark = SparkSession\ .builder\ .appName("KMeansExample")\ .getOrCreate() dataset = spark.read.format("libsvm").load("data/mllib/sample_kmeans_data.txt") # 训练K-means聚类模型 kmeans = KMeans().setK(2).setSeed(1) model = kmeans.fit(dataset) # 预测(即分配聚类中心) predictions = model.transform(dataset) # 根据Silhouette得分评估(pyspark2.2里新加) evaluator = ClusteringEvaluator() silhouette = evaluator.evaluate(predictions) print("Silhouette with squared euclidean distance = " + str(silhouette)) # 输出预测结果 print("predicted Center: ") for center in predictions[['prediction']].collect(): print(center.asDict()) # 聚类中心 centers = model.clusterCenters() print("Cluster Centers: ") for center in centers: print(center) spark.stop()
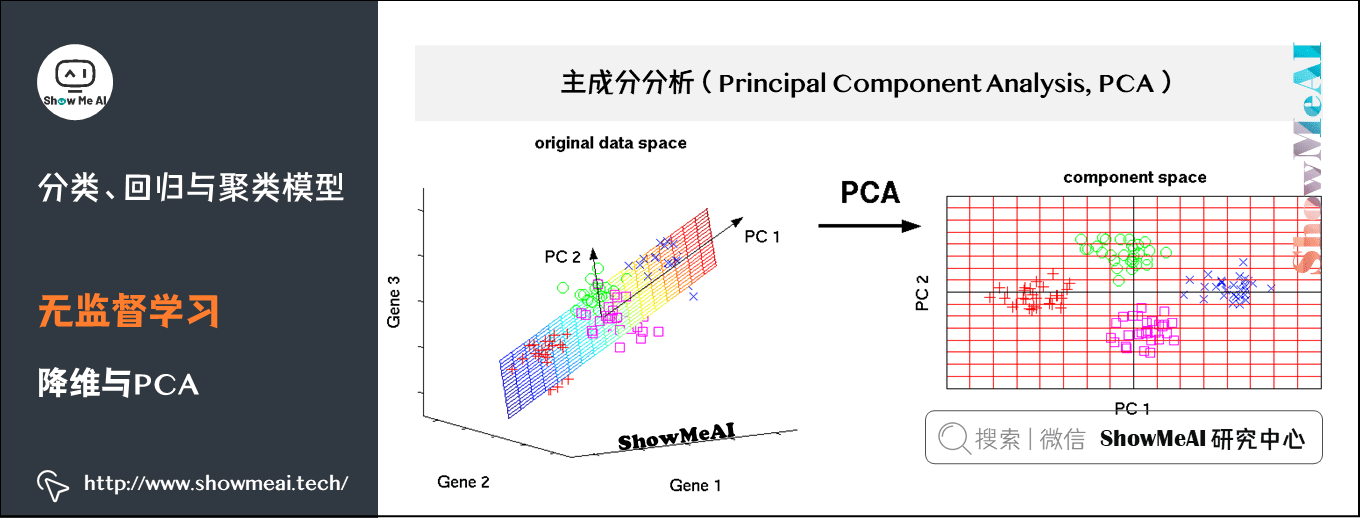
(3)降维与PCA
主成分分析(PCA) 是一种对数据进行旋转变换的统计学方法,其本质是在线性空间中进行一个基变换,使得变换后的数据投影在一组新的“坐标轴”上的方差最大化,随后,裁剪掉变换后方差很小的“坐标轴”,剩下的新“坐标轴”即被称为 主成分(Principal Component) ,它们可以在一个较低维度的子空间中尽可能地表示原有数据的性质。
主成分分析被广泛应用在各种统计学、机器学习问题中,是最常见的降维方法之一。
- 获取数据集与代码 → ShowMeAI的官方GitHub https://github.com/ShowMeAI-Hub/awesome-AI-cheatsheets
- 运行代码段与学习 → 在线编程环境 http://blog.showmeai.tech/python3-compiler
spark = SparkSession\ .builder\ .appName("PCAExample")\ .getOrCreate() # 构建一份fake data data = [(Vectors.sparse(5, [(1, 1.0), (3, 7.0)]),), (Vectors.dense([2.0, 0.0, 3.0, 4.0, 5.0]),), (Vectors.dense([4.0, 0.0, 0.0, 6.0, 7.0]),)] df = spark.createDataFrame(data, ["features"]) # PCA降维 pca = PCA(k=3, inputCol="features", outputCol="pcaFeatures") model = pca.fit(df) result = model.transform(df).select("pcaFeatures") result.show(truncate=False) spark.stop()
2.超参调优:数据切分与网格搜索
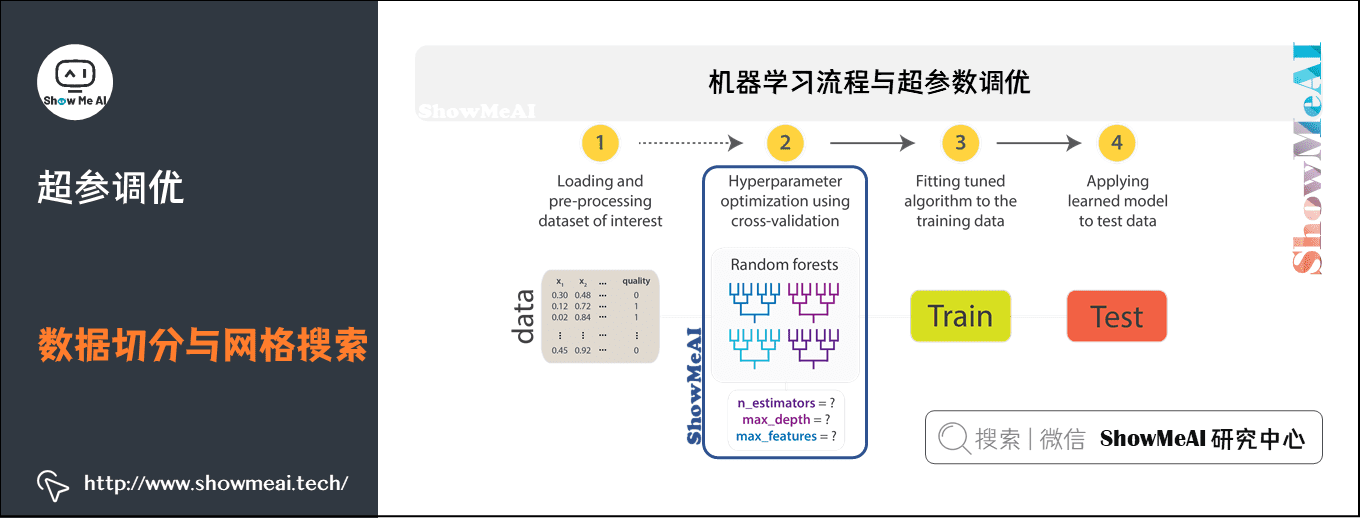
1)机器学习流程与超参数调优
在机器学习中,模型选择是非常重要的任务。
- 使用数据找到解决具体问题的最佳模型和参数,这个过程也叫做调试(Tuning)
- 调试可以在独立的估计器中完成(如逻辑回归),也可以在工作流(包含多样算法、特征工程等)中完成
- 用户应该一次性调优整个工作流,而不是独立地调整PipeLine中的每个组成部分
2)交叉验证和训练验证切分
MLlib支持交叉验证 Cross Validator和训练验证分割Train Validation Split 两个模型选择工具。使用这些工具要求包含:
- 估计器:待调试的算法或管线。
- 一系列参数表(ParamMaps):可选参数,也叫做“参数网格”搜索空间。
- 评估器:评估模型拟合程度的准则或方法。
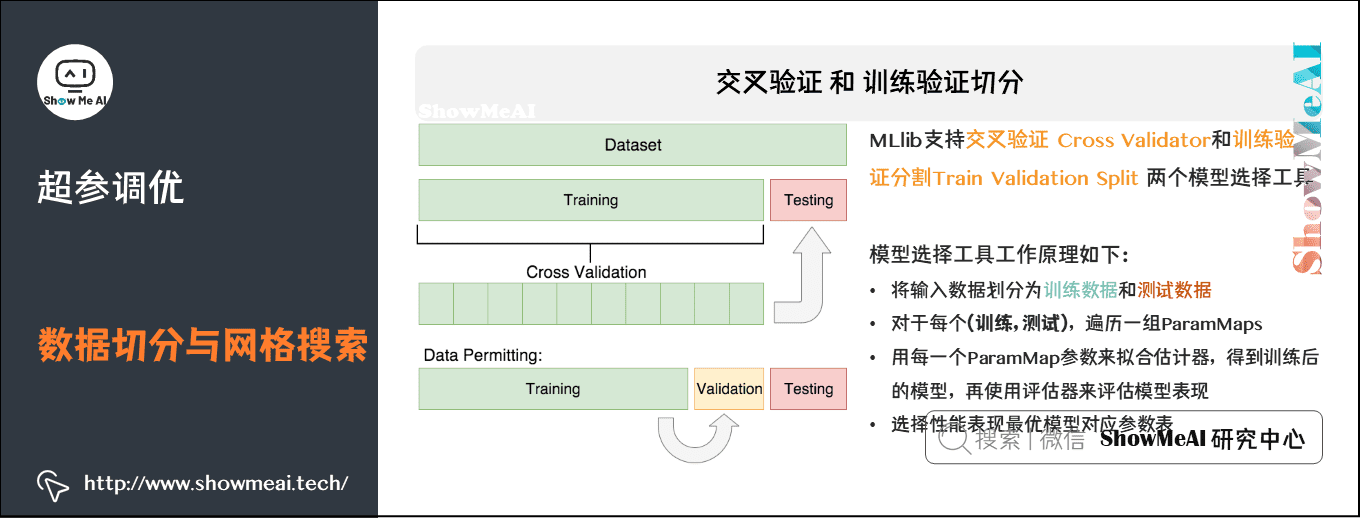
交叉验证CrossValidato将数据集切分成k折叠数据集合,并被分别用于训练和测试。例如:
- k=3时,CrossValidator会生成3个 (训练数据, 测试数据) 对,每一个数据对的训练数据占2/3,测试数据占1/3。
- 为了评估一个ParamMap,CrossValidator 会计算这3个不同的 (训练, 测试) 数据集对在Estimator拟合出的模型上的平均评估指标。
- 在找出最好的ParamMap后,CrossValidator 会使用这个ParamMap和整个的数据集来重新拟合Estimator。
也就是说,通过交叉验证找到最佳的ParamMap,利用此ParamMap在整个训练集上可以训练(fit)出一个泛化能力强,误差相对小的的最佳模型。
交叉验证的代价比较高昂,为此Spark也为超参数调优提供了训练-验证切分TrainValidationSplit。
- TrainValidationSplit创建单一的 (训练, 测试) 数据集对。
- 它使用trainRatio参数将数据集切分成两部分。例如,当设置trainRatio=0.75时,TrainValidationSplit将会将数据切分75%作为数据集,25%作为验证集,来生成训练、测试集对,并最终使用最好的ParamMap和完整的数据集来拟合评估器。
相对于CrossValidator对每一个参数进行k次评估,TrainValidationSplit只对每个参数组合评估1次
- 所以评估代价较低
- 但是,当训练数据集不够大的时候其结果相对不够可信
from pyspark.ml import Pipeline from pyspark.ml.classification import LogisticRegression from pyspark.ml.evaluation import BinaryClassificationEvaluator from pyspark.ml.feature import HashingTF, Tokenizer from pyspark.ml.tuning import CrossValidator, ParamGridBuilder from pyspark.sql import SparkSession spark = SparkSession\ .builder\ .appName("CrossValidatorExample")\ .getOrCreate() # $example on$ # Prepare training documents, which are labeled. training = spark.createDataFrame([ (0, "a b c d e spark", 1.0), (1, "b d", 0.0), (2, "spark f g h", 1.0), (3, "hadoop mapreduce", 0.0), (4, "b spark who", 1.0), (5, "g d a y", 0.0), (6, "spark fly", 1.0), (7, "was mapreduce", 0.0), (8, "e spark program", 1.0), (9, "a e c l", 0.0), (10, "spark compile", 1.0), (11, "hadoop software", 0.0) ], ["id", "text", "label"]) # Configure an ML pipeline, which consists of tree stages: tokenizer, hashingTF, and lr. tokenizer = Tokenizer(inputCol="text", outputCol="words") hashingTF = HashingTF(inputCol=tokenizer.getOutputCol(), outputCol="features") lr = LogisticRegression(maxIter=10) pipeline = Pipeline(stages=[tokenizer, hashingTF, lr]) # We now treat the Pipeline as an Estimator, wrapping it in a CrossValidator instance. # This will allow us to jointly choose parameters for all Pipeline stages. # A CrossValidator requires an Estimator, a set of Estimator ParamMaps, and an Evaluator. # We use a ParamGridBuilder to construct a grid of parameters to search over. # With 3 values for hashingTF.numFeatures and 2 values for lr.regParam, # this grid will have 3 x 2 = 6 parameter settings for CrossValidator to choose from. paramGrid = ParamGridBuilder() \ .addGrid(hashingTF.numFeatures, [10, 100, 1000]) \ .addGrid(lr.regParam, [0.1, 0.01]) \ .build() crossval = CrossValidator(estimator=pipeline, estimatorParamMaps=paramGrid, evaluator=BinaryClassificationEvaluator(), numFolds=2) # use 3+ folds in practice # Run cross-validation, and choose the best set of parameters. cvModel = crossval.fit(training) # Prepare test documents, which are unlabeled. test = spark.createDataFrame([ (4, "spark i j k"), (5, "l m n"), (6, "mapreduce spark"), (7, "apache hadoop") ], ["id", "text"]) # Make predictions on test documents. cvModel uses the best model found (lrModel). prediction = cvModel.transform(test) selected = prediction.select("id", "text", "probability", "prediction") for row in selected.collect(): print(row) spark.stop()
3.参考资料
- 数据科学工具速查 | Spark使用指南(RDD版) https://www.showmeai.tech/article-detail/106
- 数据科学工具速查 | Spark使用指南(SQL版) https://www.showmeai.tech/article-detail/107
- 黄美灵,Spark MLlib机器学习:算法、源码及实战详解, 电子工业出版社,2016
- 使用 ML Pipeline 构建机器学习工作流https://www.ibm.com/developerworks/cn/opensource/os-cn-spark-practice5/index.html
- Spark官方文档:机器学习库 (MLlib) 指南,http://spark.apachecn.org/docs/cn/2.2.0/ml-guide.html
【大数据技术与处理】推荐阅读
- 图解大数据 | 大数据生态与应用导论
- 图解大数据 | 分布式平台Hadoop与Map-Reduce详解
- 图解大数据 | Hadoop系统搭建与环境配置@实操案例
- 图解大数据 | 应用Map-Reduce进行大数据统计@实操案例
- 图解大数据 | Hive搭建与应用@实操案例
- 图解大数据 | Hive与HBase详解@海量数据库查询
- 图解大数据 | 大数据分析挖掘框架@Spark初步
- 图解大数据 | 基于RDD大数据处理分析@Spark操作
- 图解大数据 | 基于Dataframe / SQL大数据处理分析@Spark操作
- 图解大数据 | 使用Spark分析新冠肺炎疫情数据@综合案例
- 图解大数据 | 使用Spark分析挖掘零售交易数据@综合案例
- 图解大数据 | 使用Spark分析挖掘音乐专辑数据@综合案例
- 图解大数据 | Spark Streaming @流式数据处理
- 图解大数据 | 工作流与特征工程@Spark机器学习
- 图解大数据 | 建模与超参调优@Spark机器学习
- 图解大数据 | GraphFrames @基于图的数据分析挖掘
ShowMeAI系列教程推荐
- 大厂技术实现方案系列
- 图解Python编程:从入门到精通系列教程
- 图解数据分析:从入门到精通系列教程
- 图解AI数学基础:从入门到精通系列教程
- 图解大数据技术:从入门到精通系列教程
- 图解机器学习算法:从入门到精通系列教程
- 机器学习实战:手把手教你玩转机器学习系列
- 深度学习教程:吴恩达专项课程 · 全套笔记解读
- 自然语言处理教程:斯坦福CS224n课程 · 课程带学与全套笔记解读
- 深度学习与计算机视觉教程:斯坦福CS231n · 全套笔记解读


【推荐】国内首个AI IDE,深度理解中文开发场景,立即下载体验Trae
【推荐】编程新体验,更懂你的AI,立即体验豆包MarsCode编程助手
【推荐】抖音旗下AI助手豆包,你的智能百科全书,全免费不限次数
【推荐】轻量又高性能的 SSH 工具 IShell:AI 加持,快人一步
· winform 绘制太阳,地球,月球 运作规律
· 震惊!C++程序真的从main开始吗?99%的程序员都答错了
· AI与.NET技术实操系列(五):向量存储与相似性搜索在 .NET 中的实现
· 【硬核科普】Trae如何「偷看」你的代码?零基础破解AI编程运行原理
· 超详细:普通电脑也行Windows部署deepseek R1训练数据并当服务器共享给他人