【Openlayers3】在地图上添加highcharts图表

今天试用了一下ol3,效果很是不错!

ol3中有个ol.Overlay,使用这个类我们可以在地图中添加各种html要素。

下面我们在地图中添加一个饼图

html中添加一个div容器:

 <div style="display: none;">
            <div id='canvasDiv' ></div>
            <div id="popup" title="Welcome to ol3"></div>
        </div>

canvasDiv绑定到地图中:

 var pie = new ol.Overlay({
                position: pos,
                positioning: ol.OverlayPositioning.CENTER_CENTER,
                element: document.getElementById('canvasDiv')
            });
            map.addOverlay(pie);

定义饼图,填充canvasDiv:

 $(function () {
                    $('#canvasDiv').highcharts({
                        chart: {
                            backgroundColor: 'rgba(255, 255, 255, 0)',
                            plotBorderColor: null,
                            plotBackgroundColor: null,
                            plotBackgroundImage: null,
                            plotBorderWidth: null,
                            plotShadow: false,
                            width: 200,
                            height: 200,
                        },
                        tooltip: {
                            pointFormat: '{series.name}: <b>{point.percentage:.1f}%</b>'
                        },
                        plotOptions: {
                            pie: {
                                allowPointSelect: true,
                                cursor: 'pointer'
                            }
                        },
                        title: {
                            text: ''
                        },
                        dataLabels: {  
                            enabled: false,  
                            color: '#000000',  
                            //distance: -20,  
                            connectorColor: '#000000',  
                            formatter: function() {  
                                return '<b>'+ this.point.name +'</b>: '+ this.percentage +' %';  
                            }  
  
                        },
                        series: [{
                            type: 'pie',
                            name: 'Browser share',
                            data: [
                                ['Firefox', 45.0],
                                ['IE', 26.8],
                                {
                                    name: 'Chrome',
                                    y: 12.8,
                                    sliced: true,
                                    selected: true
                                },
                                ['Safari', 8.5],
                                ['Opera', 6.2],
                                ['Others', 0.7]
                            ]
                        }]
                    });
                });

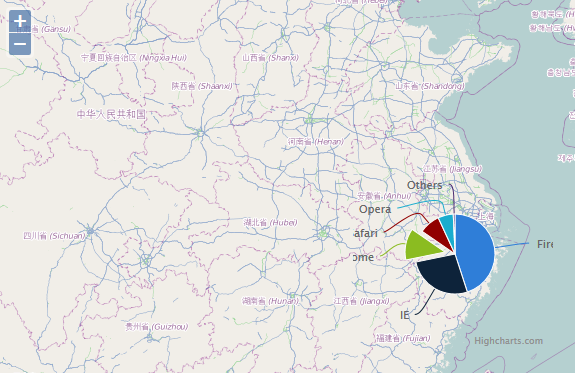
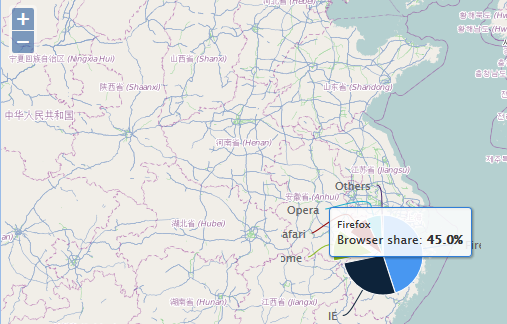
效果如下:
posted @ 2013-10-18 17:41  fengl  阅读(7396)  评论(2编辑  收藏  举报