

python给折线图添加标记
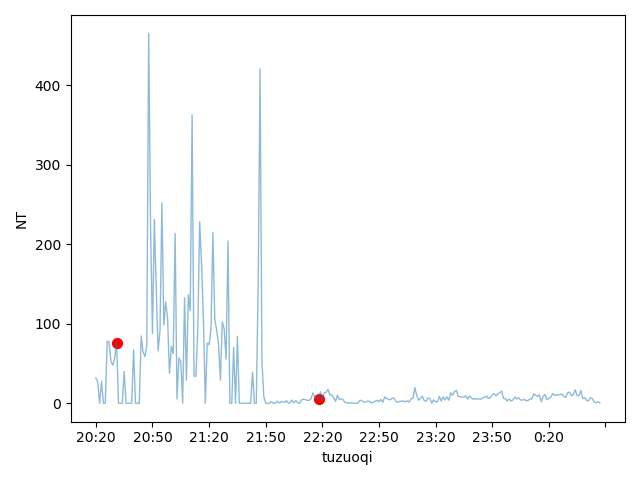
我需要记录飞机作业的开始时间和结束时间
1 2 3 4 5 6 7 8 9 10 11 12 13 14 15 16 17 18 19 20 21 22 23 24 25 26 27 28 29 30 31 32 33 | #!usr/bin/env python# -*- coding:utf-8 _*-"""@author:JK@file:jisuan.py@time:2024/03/${DAY}@desc:"""import pandas as pdimport matplotlib.pyplot as pltimport matplotlib.ticker as tickerinput_file = 'D:/呼和浩特土左旗_second.xlsx'df = pd.read_excel(input_file)x_axis_data = df['时间']y_axis_data = df['NT']start_time = df.at[11,'时间'] #时间那列对应的飞机作业开始时间的行数,为第11行start_NT = df.at[11,'NT'] # nt值那列对应的飞机作业开始时间的行数,为第11行end_time = df.at[118,'时间']end_NT = df.at[118,'NT']plt.plot(x_axis_data, y_axis_data, ls="-", alpha=0.5, linewidth=1, label='abc')plt.legendplt.gca().xaxis.set_major_locator(ticker.MultipleLocator(30))plt.scatter(start_time,start_NT,color='red',s=50)plt.scatter(end_time,end_NT,color='red',s=50)plt.xlabel('tuzuoqi')plt.ylabel('NT')plt.show() |
结果如图:


【推荐】国内首个AI IDE,深度理解中文开发场景,立即下载体验Trae
【推荐】编程新体验,更懂你的AI,立即体验豆包MarsCode编程助手
【推荐】抖音旗下AI助手豆包,你的智能百科全书,全免费不限次数
【推荐】轻量又高性能的 SSH 工具 IShell:AI 加持,快人一步
· 震惊!C++程序真的从main开始吗?99%的程序员都答错了
· 【硬核科普】Trae如何「偷看」你的代码?零基础破解AI编程运行原理
· 单元测试从入门到精通
· 上周热点回顾(3.3-3.9)
· Vue3状态管理终极指南:Pinia保姆级教程