Python监控服务器
Python代码如下:


import psutil
import time
import pymysql

db = pymysql.connect(user="root", passwd="root", db="test", host="127.0.0.1")
db.autocommit(True)
cur = db.cursor()


def getinfo():
    mem = psutil.virtual_memory()
    memtotal = mem.total
    memfree = mem.free
    mempercent = mem.percent
    memused = mem.used
    cpu = psutil.cpu_percent(1)
    return memtotal, memfree, memused, mempercent, cpu


if __name__ == "__main__":
    while True:
        try:
            memtotal, memfree, memused, mempercent, cpu = getinfo()
            t = int(time.time())
            sql = 'insert into stat (mem_free,' \
                  'mem_usage,' \
                  'mem_total,' \
                  'mempercent,' \
                  'cpu,' \
                  'time) value (%s,%s,%s,%s,%s,%s)' % (
            memfree, memused, memtotal, mempercent, cpu, t)
            cur.execute(sql)
            time.sleep(10)
        except Exception as e:
            print(e)
显示代码:
from matplotlib import pyplot as plt
import pymysql
from pyecharts.charts import Line
from pyecharts import options as opts
db = pymysql.connect(user="root", passwd="root", db="test", host="127.0.0.1")
cur = db.cursor()
sql = 'select cpu from stat'
cur.execute(sql)
cpu_data = cur.fetchall()

all_cpu = []
for cpu in cpu_data:
    cpu_num = eval(cpu[0])
    all_cpu.append(cpu_num)
print(all_cpu)
# 使用pyecharts画图
x = [i for i in range(len(all_cpu))]


line = (
    Line()
    .add_xaxis(x)
    .add_yaxis("CPUinfo", all_cpu)
    .set_global_opts(title_opts=opts.TitleOpts(title="CPUinfo"))
)
line.render()
db.close()
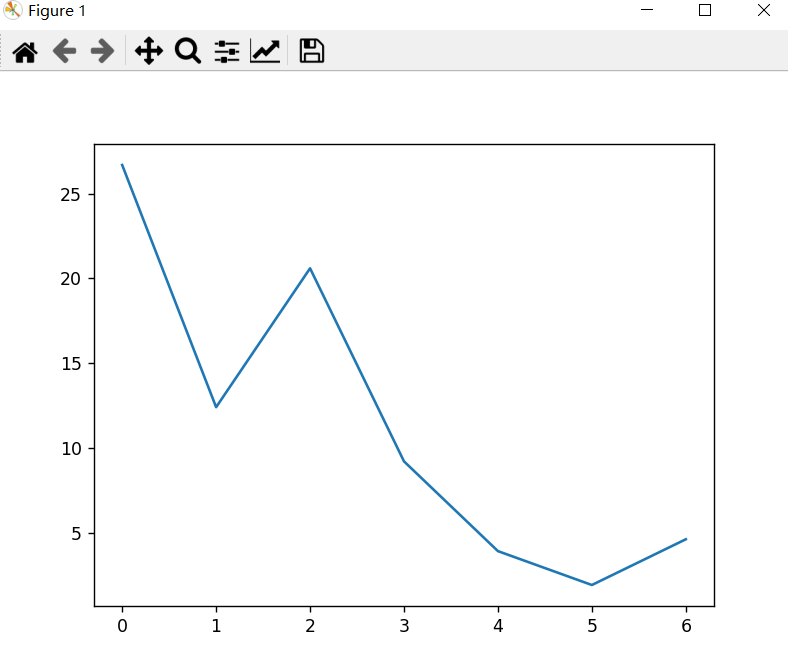
from matplotlib import pyplot as plt
plt.plot(all_cpu)
plt.show()
matplotlib做图
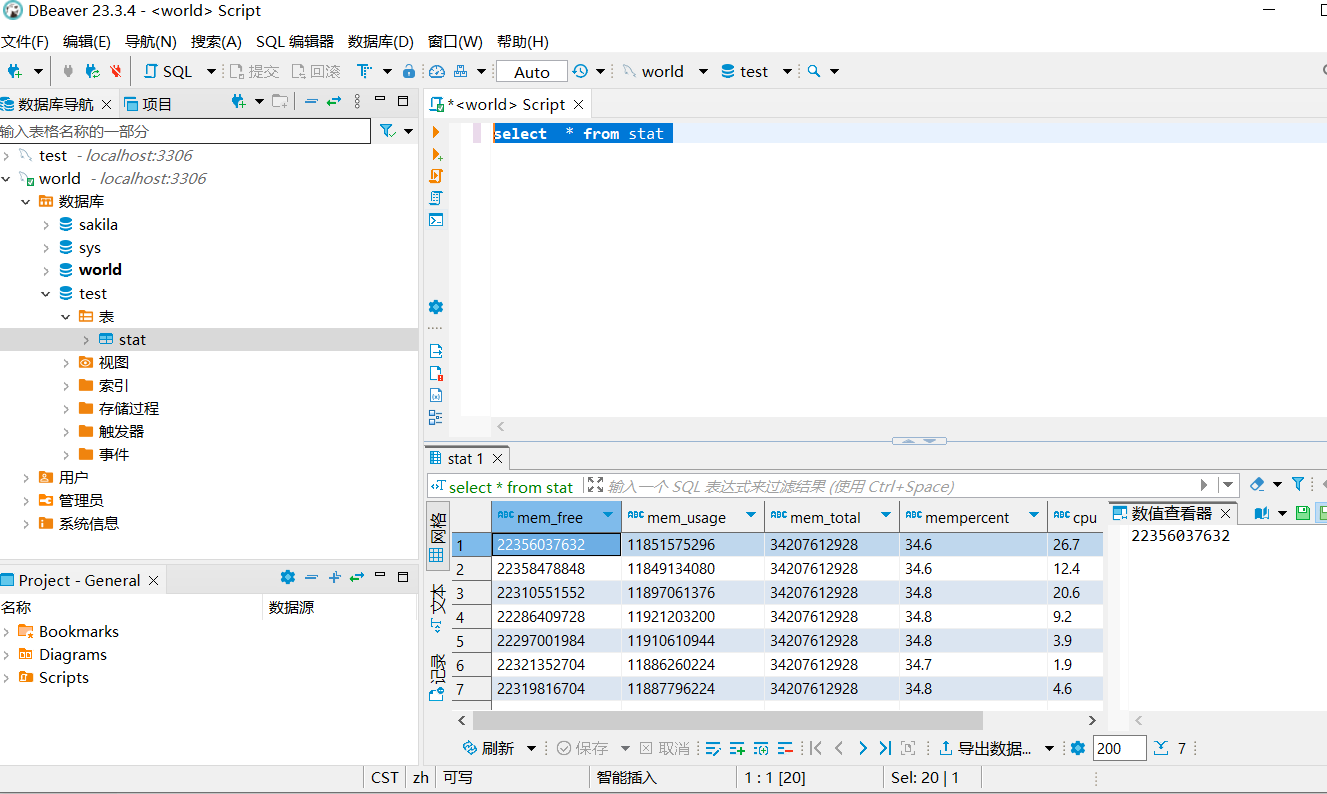
数据库数据:
,Best Wish 不负年华
