
Prometheus监控MySQL
一、采集MySQL数据
Mysqld_exporter下载地址:https://github.com/prometheus/mysqld_exporter
1.1 安装
# 解压
tar -zxvf mysqld_exporter-0.12.1.linux-amd64.tar.gz -C /usr/local/
mv /usr/local/mysqld_exporter-0.12.1.linux-amd64/ /usr/local/mysqld_exporter-0.12.1
# 创建软链接
ln -s /usr/local/mysqld_exporter-0.12.1/ /usr/local/mysqld_exporter
1.2 添加系统服务
[Unit]
Description=mysql Monitoring System
Documentation=mysql Monitoring System
[Service]
ExecStart=/usr/local/mysqld_exporter/mysqld_exporter \
--collect.info_schema.processlist \
--collect.info_schema.innodb_tablespaces \
--collect.info_schema.innodb_metrics \
--collect.perf_schema.tableiowaits \
--collect.perf_schema.indexiowaits \
--collect.perf_schema.tablelocks \
--collect.engine_innodb_status \
--collect.perf_schema.file_events \
--collect.binlog_size \
--collect.info_schema.clientstats \
--collect.perf_schema.eventswaits \
--config.my-cnf=/usr/local/mysqld_exporter/.my.cnf
[Install]
WantedBy=multi-user.target
添加配置服务
vi /usr/local/mysqld_exporter/.my.cnf

[client]
host=192.168.64.104
user=exporter
password=123456
1.3 MySQL添加授权账户
# 授权
MariaDB [(none)]> GRANT SELECT, PROCESS, SUPER, REPLICATION CLIENT, RELOAD ON *.* TO 'exporter'@'localhost' IDENTIFIED BY '123456';
Query OK, 0 rows affected (0.002 sec)
# 刷新权限
MariaDB [(none)]> flush privileges;
Query OK, 0 rows affected (0.005 sec)
1.4 启动mysqld_exporter
systemctl start mysqld_exporter
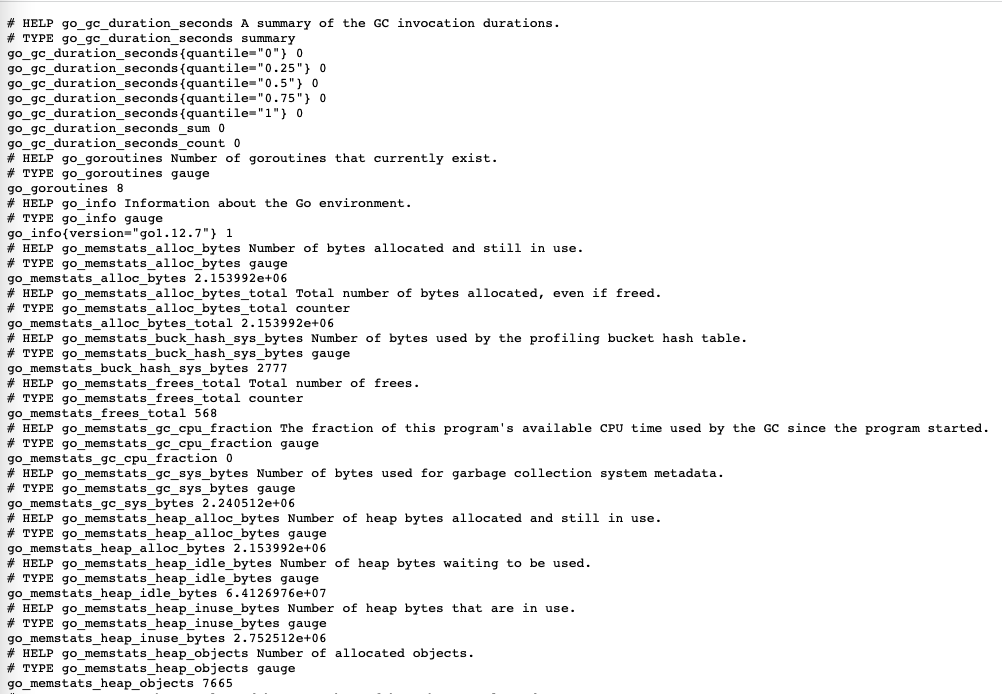
1.5 查看metrics
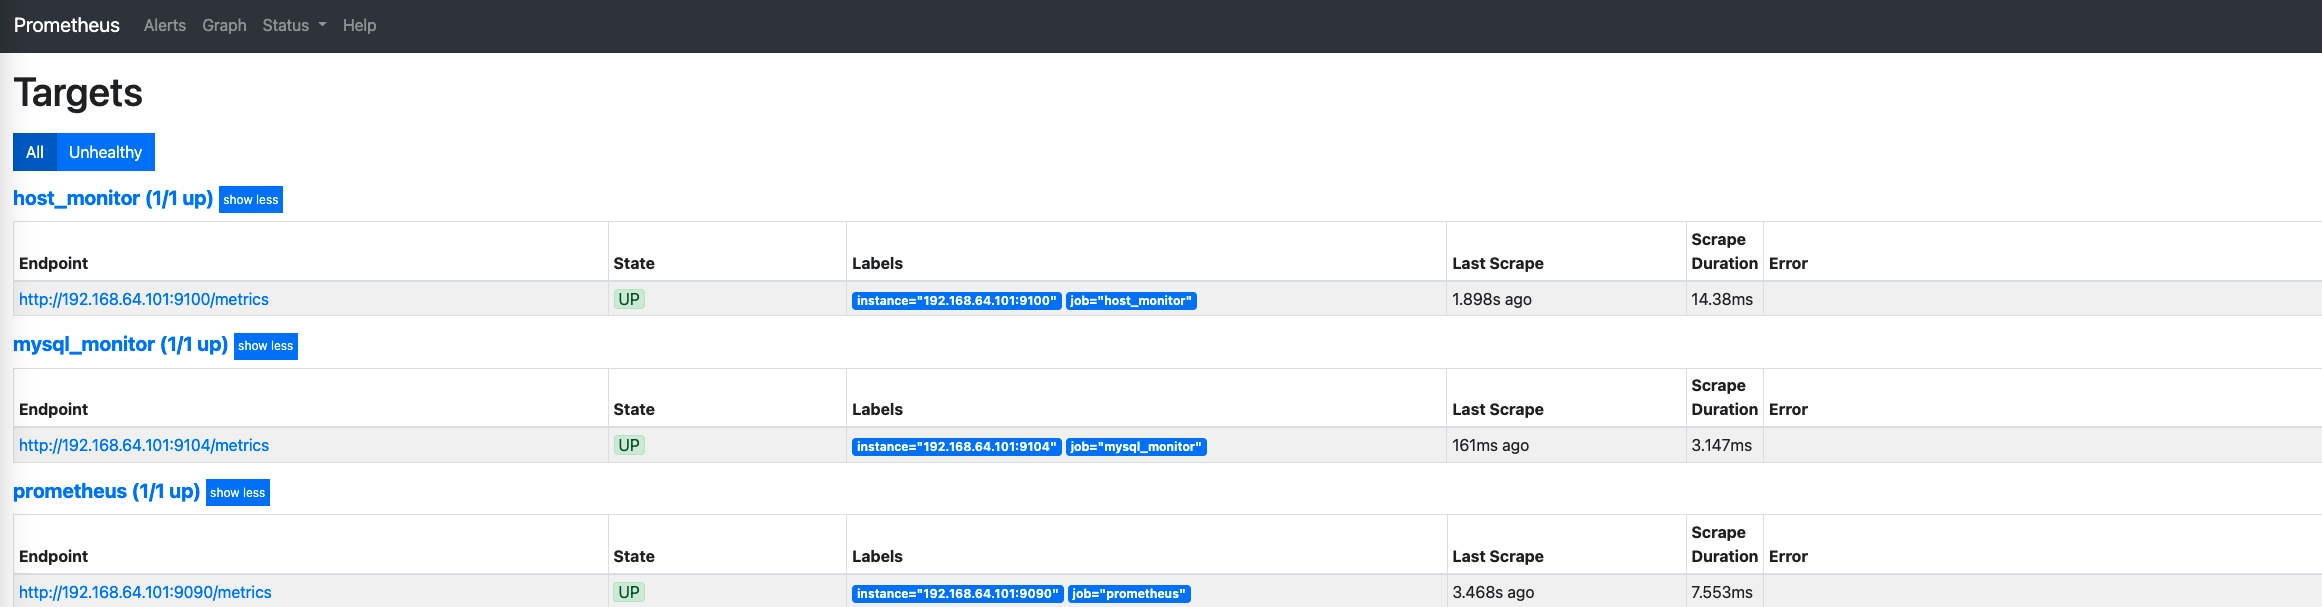
1.6 加入prometheus监控
修改prometheus配置文件 prmetheus.yml
- job_name: 'mysql_monitor'
  static_configs:
  - targets: ['192.168.64.101:9104']
重启prometheus服务
systemctl restart prometheus
1.7 Grafana接入监控模板
导入MySQL状态监控模板 14057
类似的 监控redis/Nginx/ES/jvm同理。参考对应xxx_exporter博客即可

 浙公网安备 33010602011771号