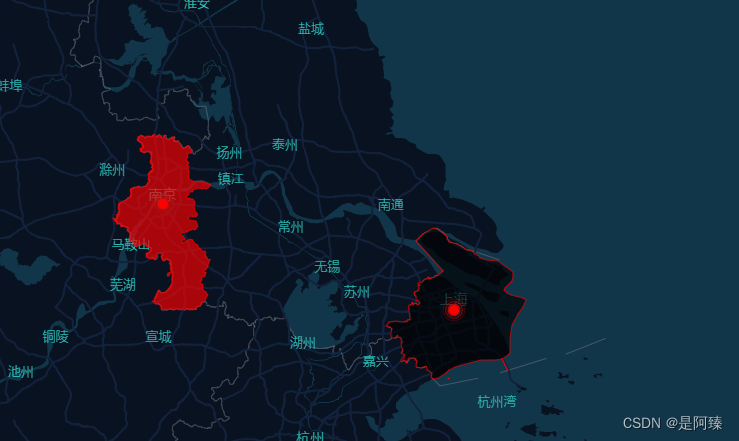
百度地图实现 区域高亮
已经封装位 api , 直接调用就可以
<!DOCTYPE html>
<html lang="en">

<head>
  <meta charset="UTF-8">
  <meta http-equiv="X-UA-Compatible" content="IE=edge">
  <meta name="viewport" content="width=device-width, initial-scale=1.0">
  <title>Document</title>
</head>

<body>
  <style>
    .bmap {
      height: 100vh;
    }
  </style>
  <!-- 百度 -->
  <script src="https://api.map.baidu.com/api?v=3.0&ak=xxxx&styleId="></script>
  <!-- echarts -->
  <script type="text/javascript" src="https://cdn.jsdelivr.net/npm/echarts@5/dist/echarts.min.js"></script>
  <!-- 扩展地图插件 -->
  <script type="text/javascript" src="https://cdn.jsdelivr.net/npm/echarts@5/dist/extension/bmap.min.js"></script>

  <div id="bmap" class="bmap"></div>
  <script src='./index.js'></script>
  <script>
    var myChart = echarts.init(document.getElementById('bmap'))
    option = {
      title: {
        text: '',
        left: 'center',
        textStyle: {
          color: '#fff'
        }
      },
      tooltip: {
        trigger: 'item',
        formatter: function (res) {
          return res.name + ':' + res.value[2]
        }
      },
      bmap: {
        center: [121.480509, 31.23592, 10],
        zoom: 10,
        roam: true,
        mapStyle: {
        },
      },
      series: [
        {
          name: '测试',
          type: 'effectScatter',
          coordinateSystem: 'bmap',
          data: [
            { name: '上海', value: [121.480509, 31.23592, 10] },
            { name: '南京', value: [118.804147, 32.070037, 10] }
          ],
          symbolSize: function (val) {
            return val[2]
          },
          rippleEffect: {
            brushType: 'stroke'
          },
          itemStyle: {
            normal: {
              color: '#ff0000',
              shadowBlur: 10,
              shadowColor: '#333'
            }
          }
        }
      ]
    }
    myChart.setOption(option)
    var bmap = myChart.getModel().getComponent('bmap').getBMap();
    bmap.setMapStyleV2({
      styleId: '5c067ea626775da3d2131d4b41d04363'
    });

    // getBoundary()

    const distirctList = [{ name: '南京', color: 'red' }, { name: '上海', color: 'black' }]

    const mapHightLight = new MapHightLight(BMap, bmap)

    mapHightLight.getDistricts(distirctList)
  </script>
</body>

</html>
class MapHightLight {
  constructor(BMap, bmapInstance) {
    this.BMap = BMap
    this.bmapInstance = bmapInstance
  }
  /**
   * @description: 获取当前区域的路径坐标
   * @param {*} distirct
   * @return {*}
   */
  #getDistrict(distirct) {
    const bdary = new this.BMap.Boundary();
    return new Promise((resolve, reject) => {
      bdary.get(distirct.name, function (res) {
        resolve({
          ...distirct,
          points: res.boundaries.reduce((pre, next) => {
            pre.push(next)
            return pre
          }, [])
        })
      });
    })
  }


  #drawBoundary(districts) {
    const pointArray = [];
    for (const district of districts) {
      const { name, color } = district
      for (const point of district.points) {
        const ply = new this.BMap.Polygon(point, {
          strokeWeight: 1, //边框宽度
          strokeColor: "red", //边框颜色
          fillColor: color //填充颜色
        }); //建立多边形覆盖物
        ply.name = name;
        this.bmapInstance.addOverlay(ply);
        const path = ply.getPath();
        pointArray.push(...path);
      }
    }
    this.bmapInstance.setViewport(pointArray)
  }

  /**
   * @description: 获取当前区域的路径坐标
   * @param { Array<any> } distirct
   * @return {*}
   */
  getDistricts(distirctList) {
    const promiseList = distirctList.reduce((pre, distirct) => {
      pre.push(this.#getDistrict(distirct))
      return pre
    }, [])

    Promise.all(promiseList).then(res => {
      this.#drawBoundary(res)
    })
  }

}

 浙公网安备 33010602011771号