

prometheus 集群
思路一
统一区域的监控目标,prometheus server两台监控相同的目标群体。

改变后

上面这个变化对于监控目标端,会多出一倍的查询请求,但在一台prometheus server宕机的情况下,可以不影响监控。
思路二
这是一个金字塔式的层次结构,而不是分布式层次结构。Prometheus 的抓取请求也会加载到prometheus work节点上,这是需要考虑的。
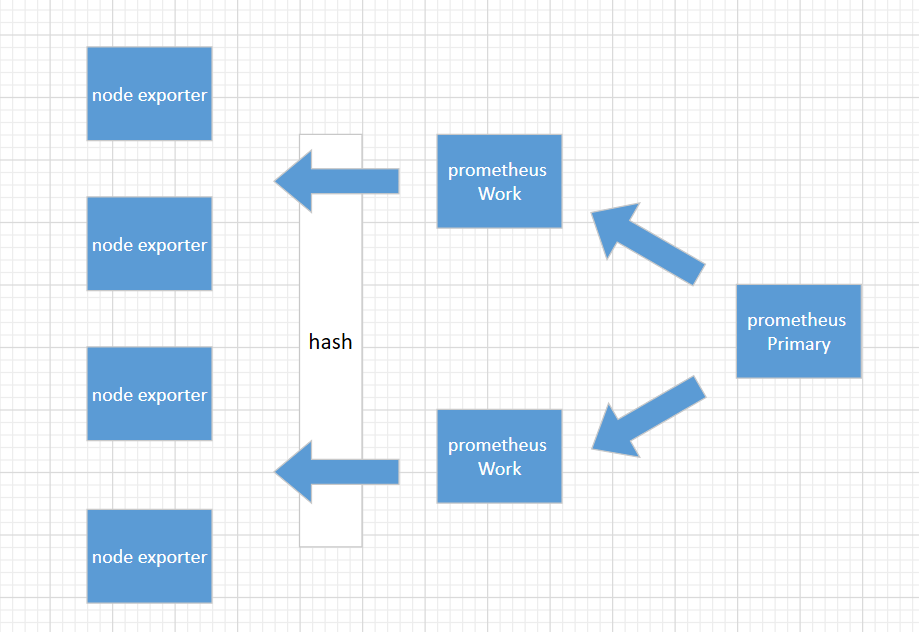
上面这种模式,准备3台prometheus server进行搭建,这种方式work节点一台宕机后,其它wokr节点不会去接手故障work节点的机器。
1、环境准备
192.168.31.151(primary)
192.168.31.144 (worker)
192.168.31.82(worker)
2、部署prometheus
1 2 3 4 5 6 7 | cd /usr/loacltar -xvf prometheus-2.8.0.linux-amd64.tar.gz ln -s /usr/local/prometheus-2.8.0.linux-amd64 /usr/local/prometheuscd /usr/local/prometheus;mkdir bin conf datamv ./promtool binmv ./prometheus binmv ./prometheus.yml conf |
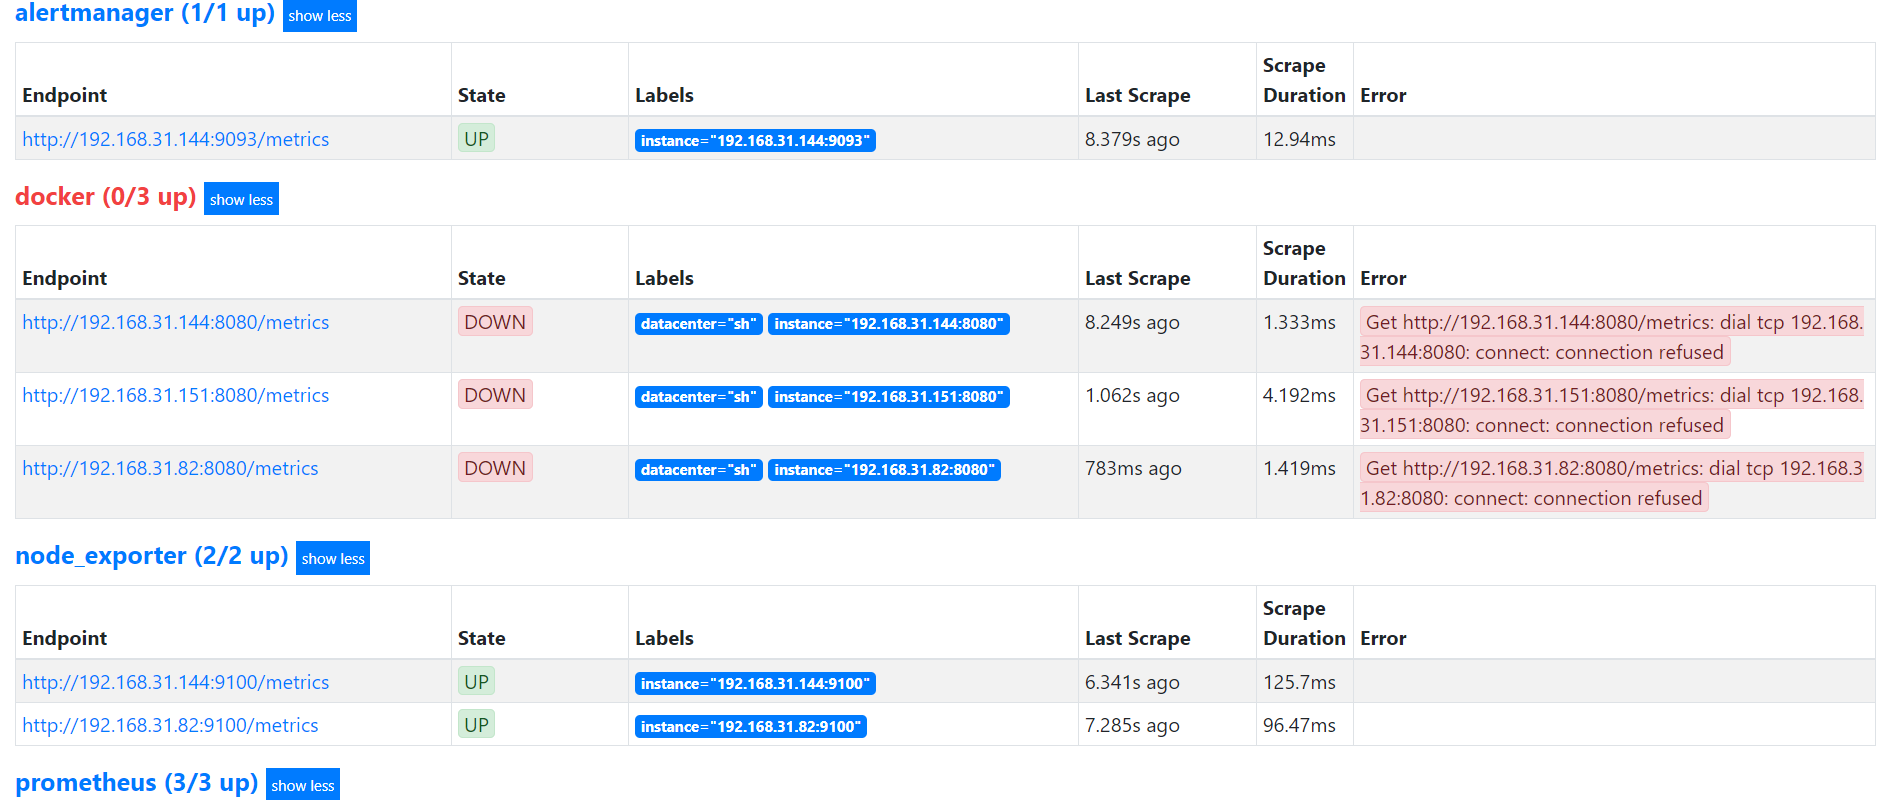
3、worker节点配置(192.168.31.144)
prometheus.yml
1 2 3 4 5 6 7 8 9 10 11 12 13 14 15 16 17 18 19 20 21 22 23 24 25 26 27 28 29 30 31 32 33 34 35 36 37 38 39 40 41 42 43 44 45 46 47 48 49 50 51 52 53 54 55 56 57 58 59 60 61 62 63 64 65 66 67 68 69 70 71 72 73 74 75 | # my global configglobal: scrape_interval: 15s # Set the scrape interval to every 15 seconds. Default is every 1 minute. evaluation_interval: 15s # Evaluate rules every 15 seconds. The default is every 1 minute. external_labels: worker: 0# Alertmanager configurationalerting: alertmanagers: - static_configs: - targets: # - alertmanager:9093# Load rules once and periodically evaluate them according to the global 'evaluation_interval'.rule_files: - "rules/*_rules.yml"# A scrape configuration containing exactly one endpoint to scrape:# Here it's Prometheus itself.scrape_configs: # The job name is added as a label `job=<job_name>` to any timeseries scraped from this config. - job_name: 'prometheus' static_configs: - targets: - 192.168.31.151:9090 - 192.168.31.144:9090 - 192.168.31.82:9090 relabel_configs: - source_labels: [__address__] modulus: 2 target_label: __tmp_hash action: hashmod - source_labels: [__tmp_hash] regex: ^0$ action: keep - job_name: 'node_exporter' file_sd_configs: - files: - targets/nodes/*.json refresh_interval: 1m relabel_configs: - source_labels: [__address__] modulus: 2 target_label: __tmp_hash action: hashmod - source_labels: [__tmp_hash] regex: ^0$ action: keep - job_name: 'docker' file_sd_configs: - files: - targets/docker/*.json refresh_interval: 1m relabel_configs: - source_labels: [__address__] modulus: 2 target_label: __tmp_hash action: hashmod - source_labels: [__tmp_hash] regex: ^0$ action: keep - job_name: 'alertmanager' static_configs: - targets: - 192.168.31.151:9093 - 192.168.31.144:9093 relabel_configs: - source_labels: [__address__] modulus: 2 target_label: __tmp_hash action: hashmod - source_labels: [__tmp_hash] regex: ^0$ action: keep |
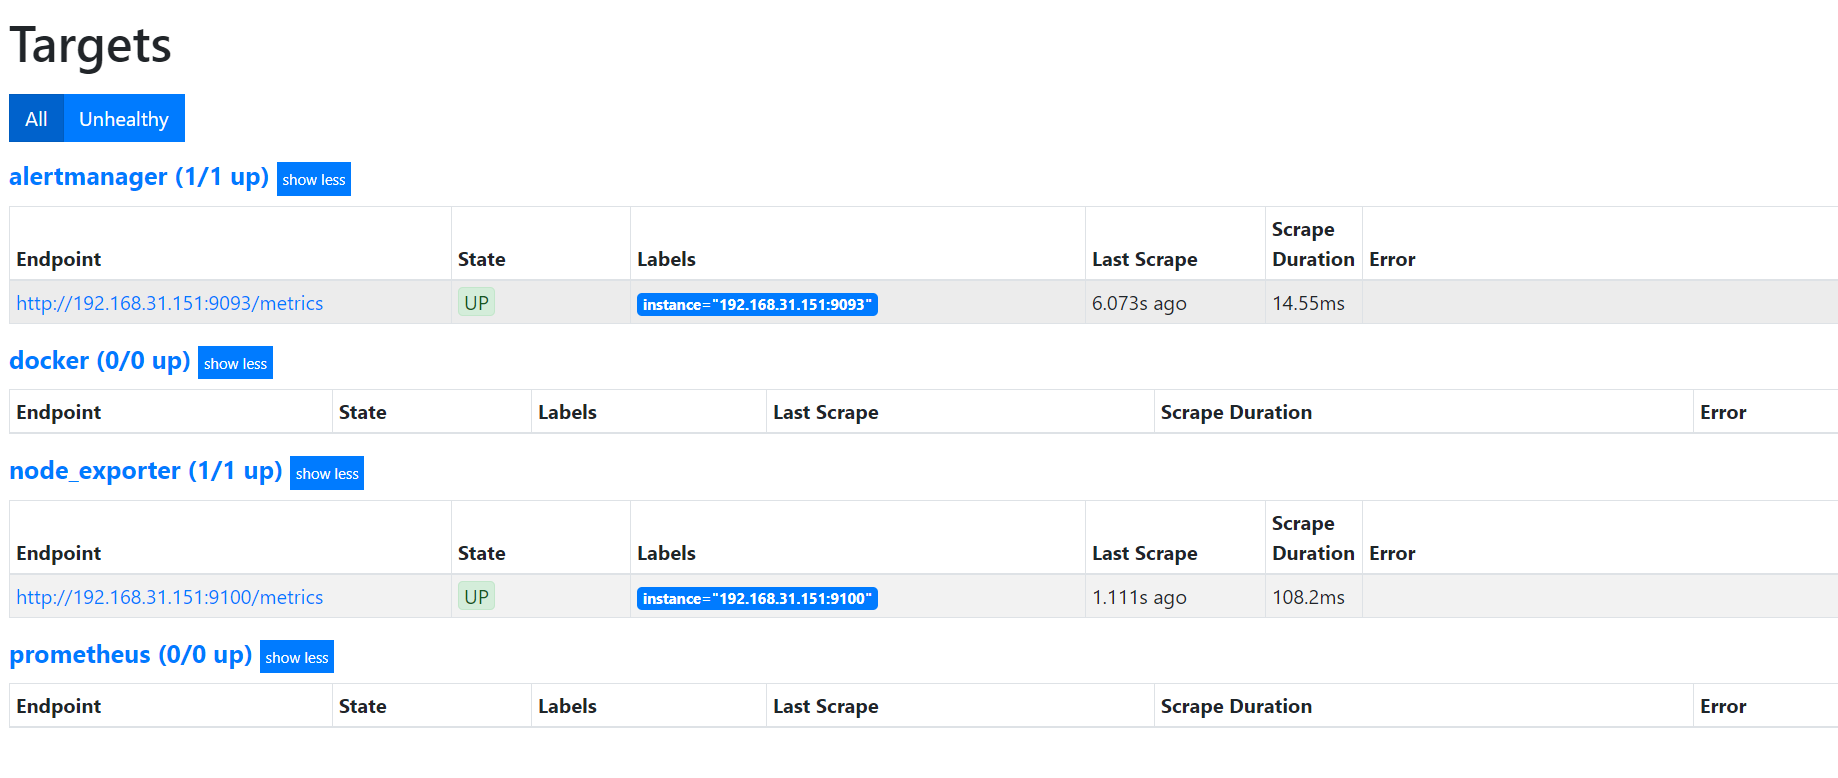
worker节点配置(192.168.31.82)
prometheus.yml
1 2 3 4 5 6 7 8 9 10 11 12 13 14 15 16 17 18 19 20 21 22 23 24 25 26 27 28 29 30 31 32 33 34 35 36 37 38 39 40 41 42 43 44 45 46 47 48 49 50 51 52 53 54 55 56 57 58 59 60 61 62 63 64 65 66 67 68 69 70 71 72 73 74 75 | # my global configglobal: scrape_interval: 15s # Set the scrape interval to every 15 seconds. Default is every 1 minute. evaluation_interval: 15s # Evaluate rules every 15 seconds. The default is every 1 minute. external_labels: worker: 1# Alertmanager configurationalerting: alertmanagers: - static_configs: - targets: # - alertmanager:9093# Load rules once and periodically evaluate them according to the global 'evaluation_interval'.rule_files: - "rules/*_rules.yml"# A scrape configuration containing exactly one endpoint to scrape:# Here it's Prometheus itself.scrape_configs: # The job name is added as a label `job=<job_name>` to any timeseries scraped from this config. - job_name: 'prometheus' static_configs: - targets: - 192.168.31.151:9090 - 192.168.31.144:9090 - 192.168.31.82:9090 relabel_configs: - source_labels: [__address__] modulus: 2 target_label: __tmp_hash action: hashmod - source_labels: [__tmp_hash] regex: ^1$ action: keep - job_name: 'node_exporter' file_sd_configs: - files: - targets/nodes/*.json refresh_interval: 1m relabel_configs: - source_labels: [__address__] modulus: 2 target_label: __tmp_hash action: hashmod - source_labels: [__tmp_hash] regex: ^1$ action: keep - job_name: 'docker' file_sd_configs: - files: - targets/docker/*.json refresh_interval: 1m relabel_configs: - source_labels: [__address__] modulus: 2 target_label: __tmp_hash action: hashmod - source_labels: [__tmp_hash] regex: ^1$ action: keep - job_name: 'alertmanager' static_configs: - targets: - 192.168.31.151:9093 - 192.168.31.144:9093 relabel_configs: - source_labels: [__address__] modulus: 2 target_label: __tmp_hash action: hashmod - source_labels: [__tmp_hash] regex: ^1$ action: keep |
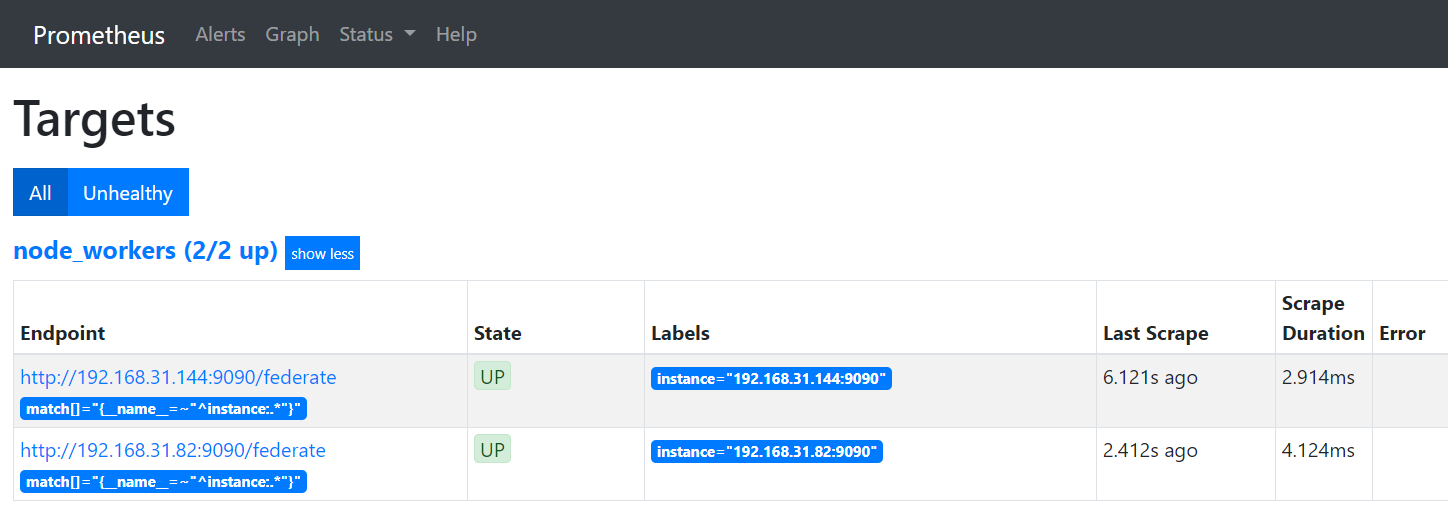
primary节点配置(192.168.31.151)
prometheus.yml
1 2 3 4 5 6 7 8 9 10 11 12 13 14 15 16 17 18 19 20 21 22 23 24 25 26 27 28 29 30 31 | # my global configglobal: scrape_interval: 15s # Set the scrape interval to every 15 seconds. Default is every 1 minute. evaluation_interval: 15s # Evaluate rules every 15 seconds. The default is every 1 minute. # scrape_timeout is set to the global default (10s).# Alertmanager configurationalerting: alertmanagers: - static_configs: - targets: - 192.168.31.151:9093 - 192.168.31.144:9093# Load rules once and periodically evaluate them according to the global 'evaluation_interval'.rule_files: - "rules/*_alerts.yml"# A scrape configuration containing exactly one endpoint to scrape:# Here it's Prometheus itself.scrape_configs: - job_name: 'node_workers' file_sd_configs: - files: - 'targets/workers/*.json' refresh_interval: 5m honor_labels: true metrics_path: /federate params: 'match[]': - '{__name__=~"^instance:.*"}' |
cat ./targets/workers/workers.json
1 2 3 4 5 6 | [{ "targets": [ "192.168.31.144:9090", "192.168.31.82:9090" ]}] |


【推荐】国内首个AI IDE,深度理解中文开发场景,立即下载体验Trae
【推荐】编程新体验,更懂你的AI,立即体验豆包MarsCode编程助手
【推荐】抖音旗下AI助手豆包,你的智能百科全书,全免费不限次数
【推荐】轻量又高性能的 SSH 工具 IShell:AI 加持,快人一步
· 10年+ .NET Coder 心语,封装的思维:从隐藏、稳定开始理解其本质意义
· .NET Core 中如何实现缓存的预热?
· 从 HTTP 原因短语缺失研究 HTTP/2 和 HTTP/3 的设计差异
· AI与.NET技术实操系列:向量存储与相似性搜索在 .NET 中的实现
· 基于Microsoft.Extensions.AI核心库实现RAG应用
· 10年+ .NET Coder 心语 ── 封装的思维:从隐藏、稳定开始理解其本质意义
· 地球OL攻略 —— 某应届生求职总结
· 提示词工程——AI应用必不可少的技术
· Open-Sora 2.0 重磅开源!
· 周边上新:园子的第一款马克杯温暖上架