
prometheus 配置介绍
prometheus 配置介绍
prometheus 配置分global、alerting、rule_files、scrape_configs
1、global(全局配置)
scrape_interval:拉取metric值得间隔时间
evaluation_interval:控制rules文件的频率,prometheus使用规则产生新的时间序列数据或者产生警报。
2、alerting(报警定义)
设定alertmanager和prometheus交互的接口,即alertmanager监听的ip地址和端口。
3、rule_files
rule配置,首次读取默认加载,之后根据evaluation_interval设定的周期加载。
4、scrape_configs
配置拉取目录
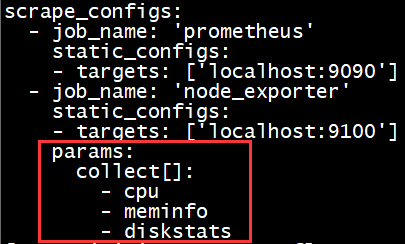
- 静态配置样例,增加本机自己的node_exporter监控点,配置后需要重启应用,或者向prometheus进程发送SIGHUP信号

- 过滤收集指定监控项,下面样例只收集cpu、mem、disk信息
热加载更新配置
热更新加载方法有两种:
- kill -HUP pid
- curl -X POST http://IP/-/reload
使用上面第二种方式需要启动 Prometheus 的时候,添加 --web.enable-lifecycle 参数
nohup /usr/local/prometheus/bin/prometheus --config.file=/usr/local/prometheus/conf/prometheus.yml --storage.tsdb.path=/usr/local/prometheus/data --web.enable-lifecycle &
配置文件检查方式
./promtool check config /usr/local/prometheus/conf/prometheus.yml

systemd配置
[Unit]
Description=Prometheus Server
Documentation=https://prometheus.io/docs/introduction/overview/
After=network.target

[Service]
LimitNOFILE=204800
Type=simple
ExecStart=/opt/prometheus/prometheus \
	--config.file /opt/prometheus/prometheus.yml \
	--web.enable-lifecycle \
	--web.enable-admin-api \
	--storage.tsdb.no-lockfile \
	--storage.tsdb.retention.time 90d \
	--storage.tsdb.wal-compression \
	--storage.tsdb.path /opt/prometheus/data

[Install]
WantedBy=multi-user.target
Prometheus relabel 配置的 hashmod
relabel_configs:
- source_labels: [__address__]
  modulus:       4    # 将节点分片成 4 个 group
  target_label:  __tmp_hash
  action:        hashmod
- source_labels: [__tmp_hash]
  regex:         ^1$  # 只抓第 2 个 group 中节点的数据(序号 0 为第 1 个 group)
  action:        keep
Prometheus relabel 配置的 hashmod 来对 Node 做分片,每个 Prometheus 实例仅抓其中一个分片中的数据。

