R 语言柱状图示例笔记
由于微信不允许外部链接,你需要点击文章尾部左下角的 "阅读原文",才能访问文章中链接。
一、基础柱状图
1. barplot 命令
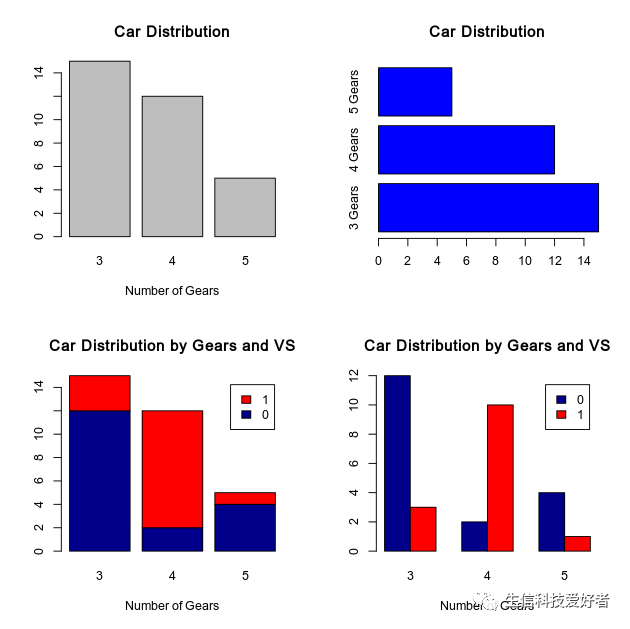
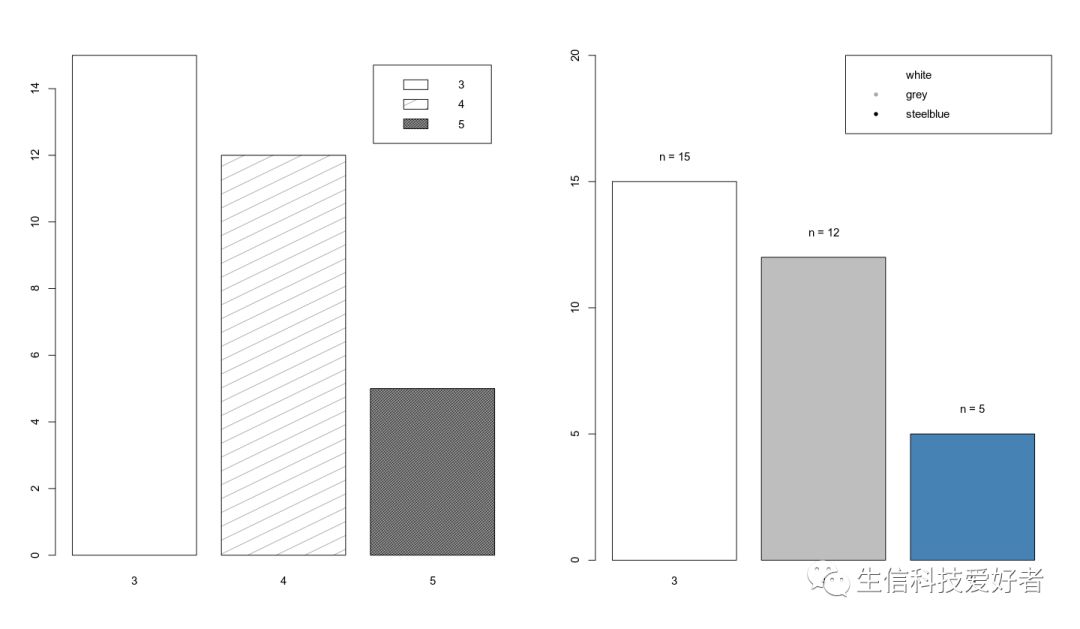
基于barplot基础柱状图颜色、方向及分组的绘图示例。
par(mfrow=c(2,2))
counts <- table(mtcars$gear)
barplot(counts, main="Car Distribution", xlab="Number of Gears")
barplot(counts, main="Car Distribution", horiz=TRUE,names.arg=c("3 Gears", "4 Gears", "5 Gears"),col="blue")
counts2 <- table(mtcars$vs, mtcars$gear)
barplot(counts2, main="Car Distribution by Gears and VS",xlab="Number of Gears", col=c("darkblue","red"),legend = rownames(counts2))
barplot(counts2, main="Car Distribution by Gears and VS",xlab="Number of Gears", col=c("darkblue","red"),legend = rownames(counts2),beside=TRUE)
2. ggplot2 包绘制柱状图
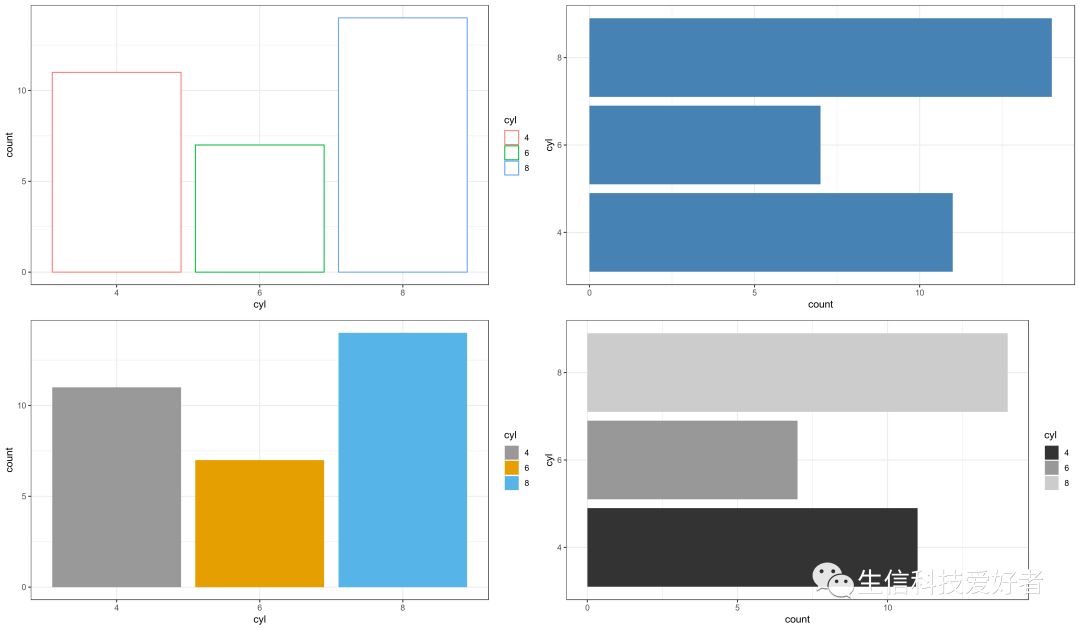
使用ggplot2包的柱状图颜色、方向及分组的绘图示例。
library('ggplot2')
p1<-ggplot(data=mtcars,aes(x=cyl,col=cyl)) + geom_bar(stat="count",fill="white") + theme_bw()
p2<-ggplot(data=mtcars,aes(x=cyl)) + geom_bar(stat="count",fill="steelblue") + theme_bw()  + coord_flip()
p3<-ggplot(data=mtcars,aes(x=cyl,fill=cyl)) + geom_bar(stat="count") + theme_bw() +scale_fill_manual(values=c("#999999", "#E69F00", "#56B4E9"))
p4<-ggplot(data=mtcars,aes(x=cyl,fill=cyl)) + geom_bar(stat="count") + theme_bw() +scale_fill_grey() + coord_flip()
gridExtra::grid.arrange(p1, p2,p3,p4,nrow=2)
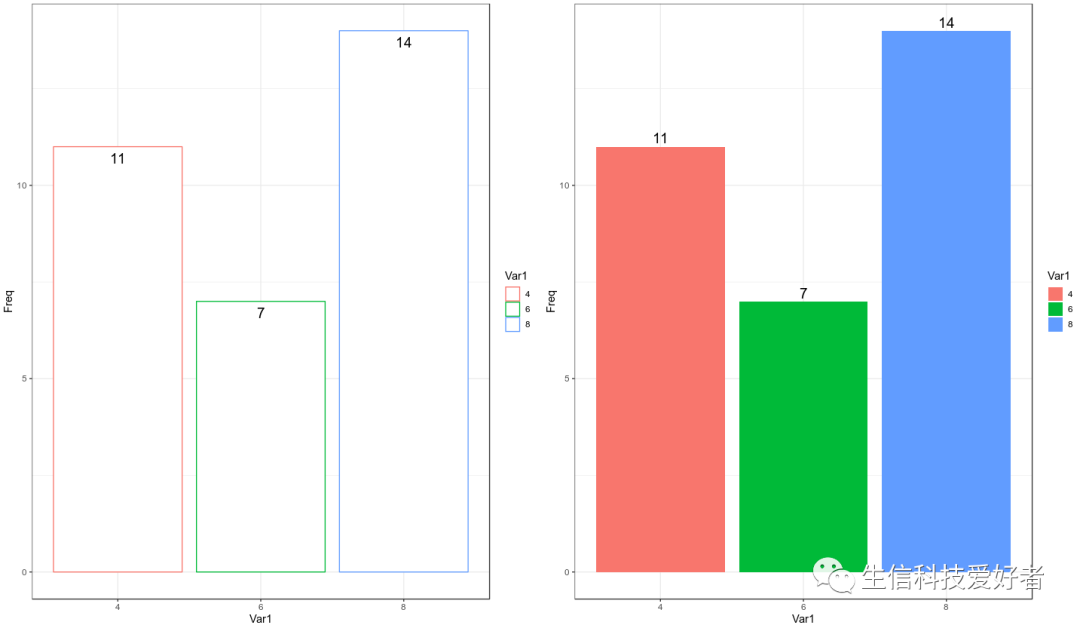
2.1 柱状图添加标签
data <- data.frame(table(mtcars$cyl))

p1 <- ggplot(data=newmatrix,aes(x=Var1,y=Freq,col=Var1)) +
    geom_bar(stat="identity",fill="white") +
    theme_bw() +
    geom_text(aes(label=Freq), vjust=1.6, color="black", size=5)

p2 <- ggplot(data=newmatrix,aes(x=Var1,y=Freq,fill=Var1)) +
    geom_bar(stat="identity") +
    theme_bw()+ geom_text(aes(label=Freq),vjust=-0.3, color="black", size=5)

gridExtra::grid.arrange(p1,p2,nrow=1)
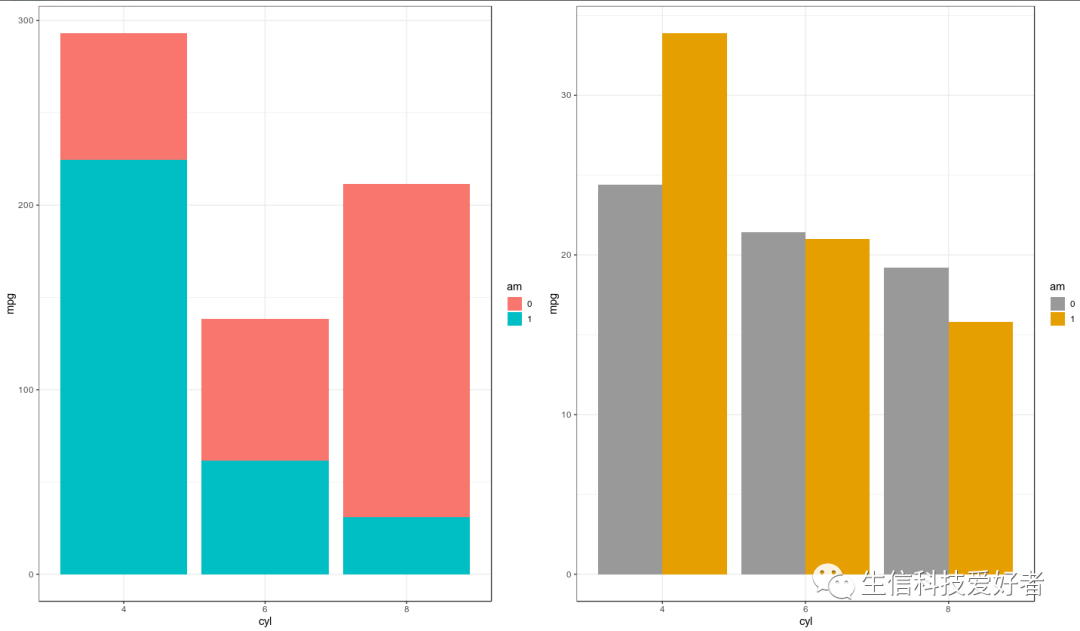
2.2 按组绘制柱状图
mtcars$am <- as.factor(mtcars$am)

p1 <- ggplot(data=mtcars,aes(x=cyl,y=mpg,fill=am)) +
    geom_bar(stat="identity") +
    theme_bw()
p2 <- ggplot(data=mtcars,aes(x=cyl,y=mpg,fill=am)) +
    geom_bar(stat="identity",position=position_dodge()) +
    theme_bw() +
    scale_fill_manual(values=c('#999999','#E69F00'))

gridExtra::grid.arrange(p1,p2,nrow=1)
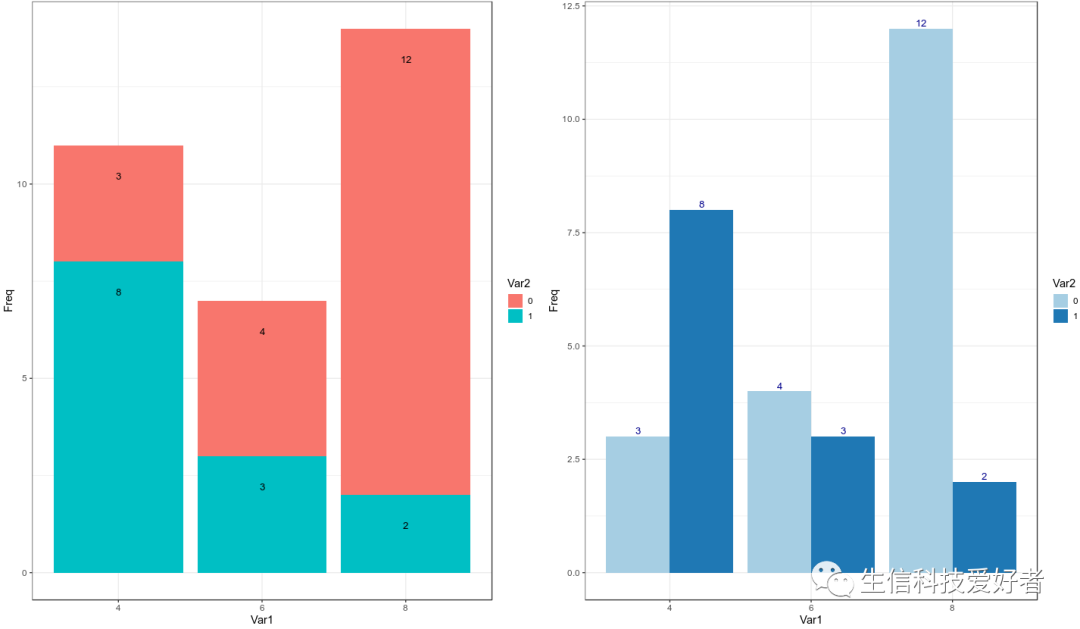
2.3 柱状图添加标签
counts2 <- data.frame(table(mtcars$cyl,mtcars$am))
p1 <- ggplot(data=counts2,aes(x=Var1,y=Freq,fill=Var2)) +
    geom_bar(stat="identity") +
    theme_bw() +
    geom_text(aes(label=Freq), vjust=5,position='stack', color="black",size=3.5)

p2 <- ggplot(data=counts2,aes(x=Var1,y=Freq,fill=Var2)) +
    geom_bar(stat="identity",position=position_dodge()) +
    theme_bw() +
    scale_fill_brewer(palette="Paired") +
    geom_text(aes(label=Freq),vjust=-0.3, color="darkblue",
            position=position_dodge(0.9), size=3.5)

gridExtra::grid.arrange(p1,p2,nrow=1)
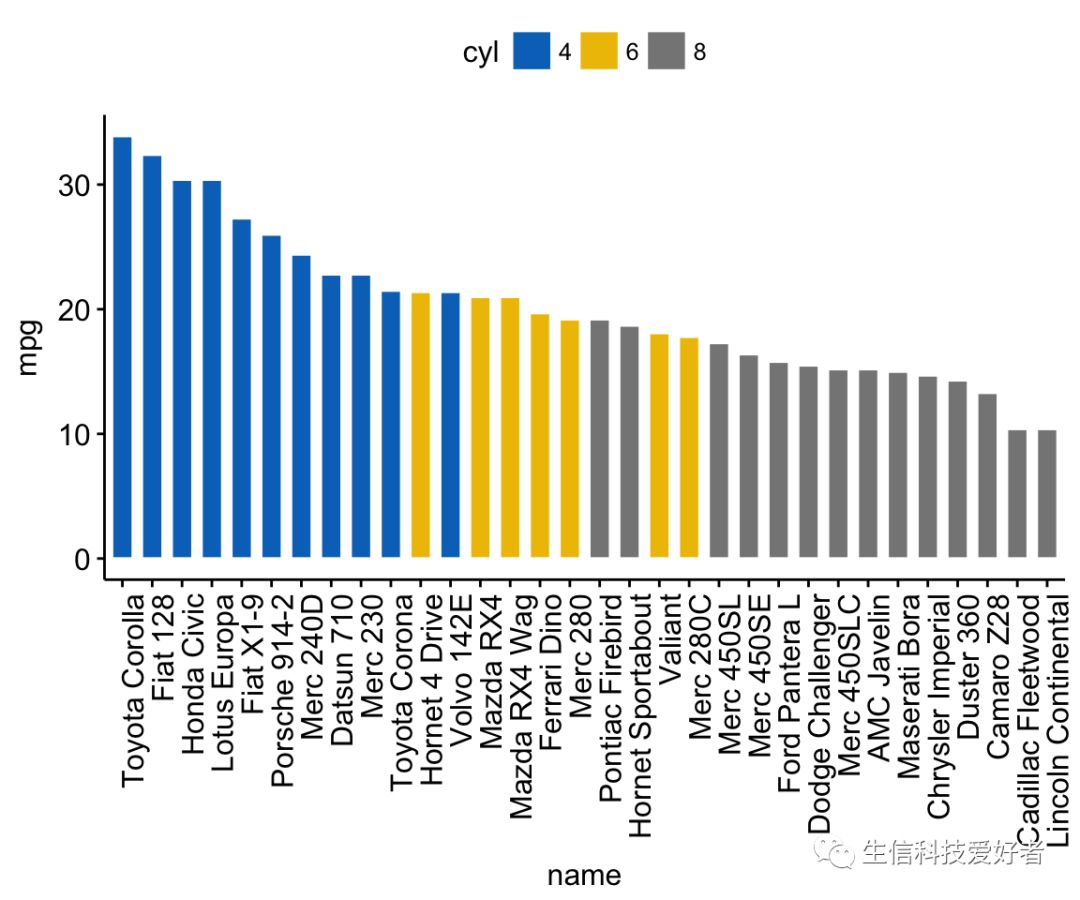
3. ggpubr 包绘制柱状图
library(ggpubr)
dfm <- mtcars
dfm$cyl <- as.factor(dfm$cyl)
dfm$name <- rownames(dfm)
ggbarplot(dfm, x="name", y="mpg",fill="cyl",color="white",palette="jco",
          sort.val="desc",sort.by.groups=FALSE,x.text.angle=90)
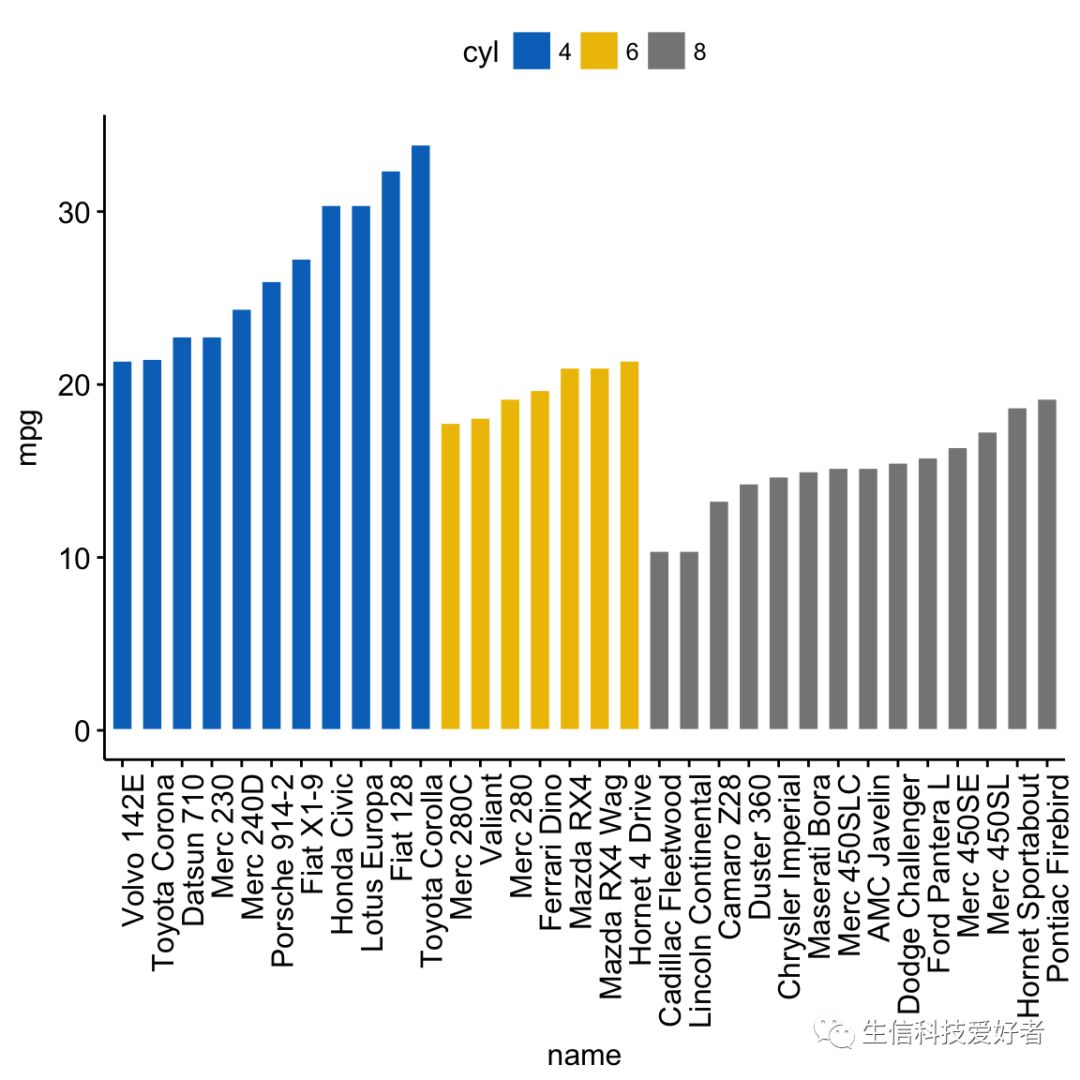
3.1 分组绘制柱状图
ggbarplot(dfm, x="name", y ="mpg", fill="cyl", color="white", palette="jco",
          sort.val="asc", sort.by.groups=TRUE, x.text.angle=90)
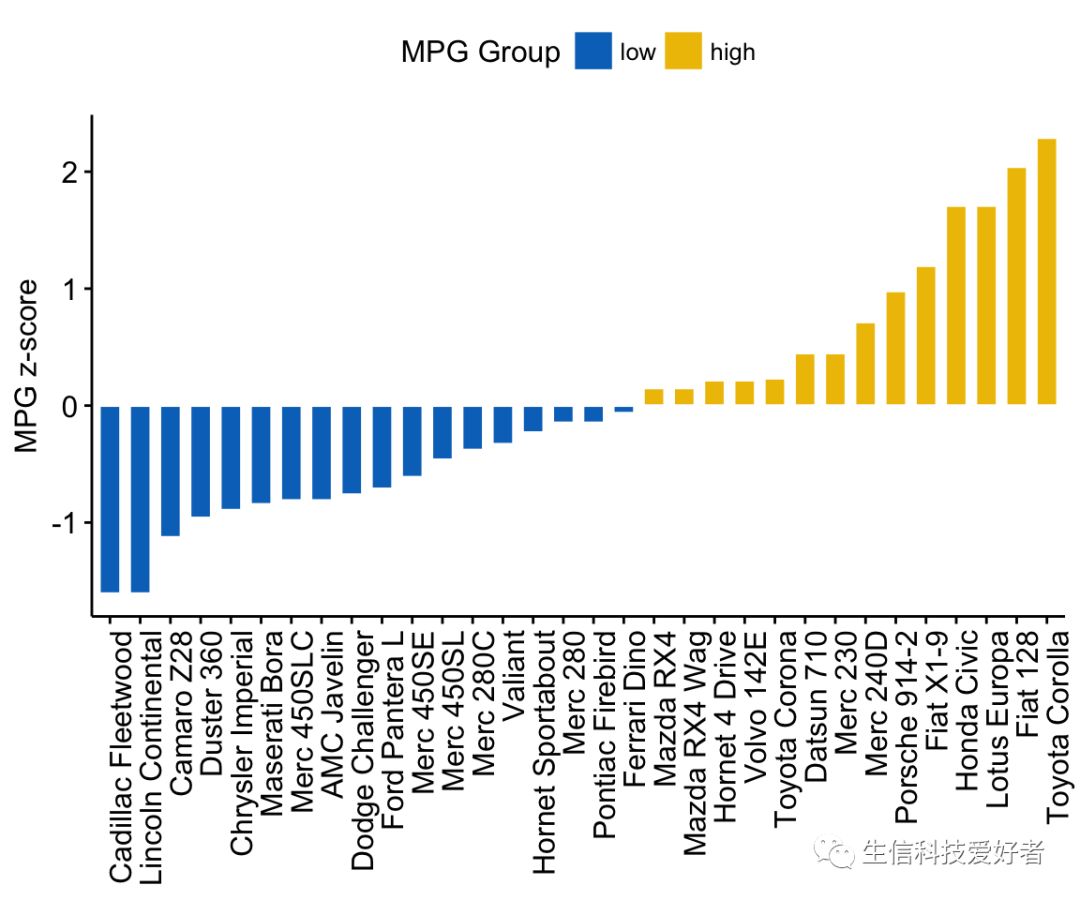
3.2 zsore 校正及分组
dfm$mpg_z <- (dfm$mpg -mean(dfm$mpg))/sd(dfm$mpg)
dfm$mpg_grp <- factor(ifelse(dfm$mpg_z < 0, "low", "high"),levels = c("low", "high"))
ggbarplot(dfm, x = "name", y = "mpg_z",fill = "mpg_grp", color = "white",
          palette = "jco", sort.val = "asc",sort.by.groups = FALSE,x.text.angle = 90,
          ylab = "MPG z-score",xlab = FALSE,legend.title = "MPG Group")
3.3 图像旋转
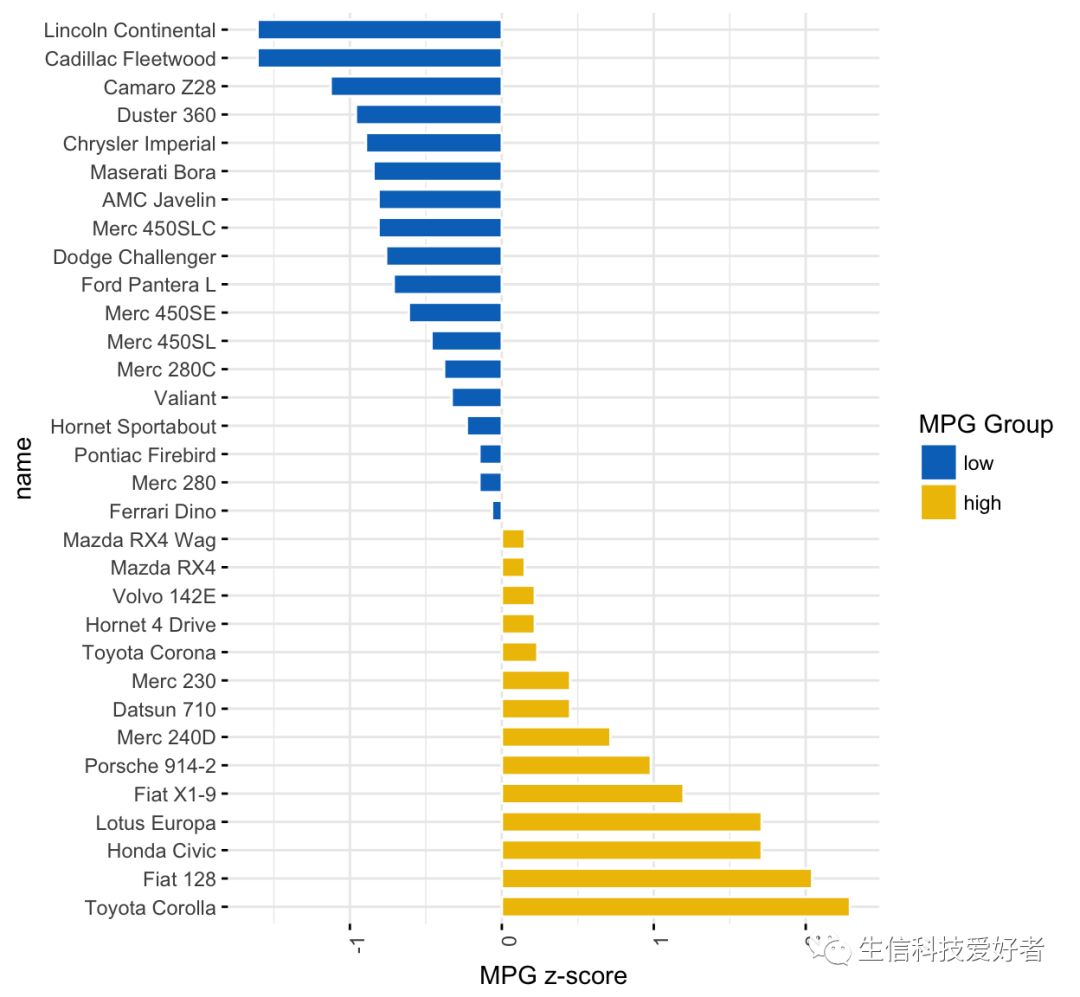
ggbarplot(dfm, x = "name", y = "mpg_z",fill = "mpg_grp",color = "white",
          palette = "jco",sort.val = "desc",sort.by.groups = FALSE,
          x.text.angle = 90,ylab = "MPG z-score",legend.title = "MPG Group",
          rotate = TRUE,ggtheme = theme_minimal())
二、添加误差线(Error bar)
1. barplot+segments+arrows 绘制误差线
1.1 绘制普通柱状图
构建数据集
myData <- aggregate(mtcars$mpg,by = list(cyl = mtcars$cyl, gears = mtcars$gear), FUN = function(x) c(mean = mean(x), sd = sd(x),n = length(x)))
myData <- do.call(data.frame, myData)
myData
  cyl gears x.mean      x.sd x.n
1   4     3 21.500        NA   1
2   6     3 19.750 2.3334524   2
3   8     3 15.050 2.7743959  12
4   4     4 26.925 4.8073604   8
5   6     4 19.750 1.5524175   4
6   4     5 28.200 3.1112698   2
7   6     5 19.700        NA   1
8   8     5 15.400 0.5656854   2
- 计算标准差
myData$se <- myData$x.sd / sqrt(myData$x.n)
colnames(myData) <- c("cyl", "gears", "mean", "sd", "n", "se")
myData$names <- c(paste(myData$cyl, "cyl /", myData$gears, " gear"))
- 定义作图范围
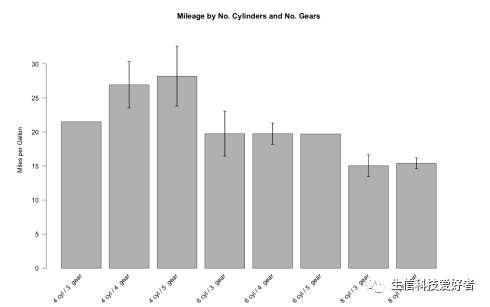
par(mar = c(5, 6, 4, 5) + 0.1)
plotTop <- max(myData$mean) +myData[myData$mean == max(myData$mean), 6] * 3
barCenters <- barplot(height = myData$mean, names.arg = myData$names,
                      beside = true, las = 2, ylim = c(0, plotTop),
                      cex.names = 0.75, xaxt = "n",
                      main = "Mileage by No. Cylinders and No. Gears",
                      ylab = "Miles per Gallon",  border = "black", axes = TRUE)
- 横坐标
text(x = barCenters, y = par("usr")[3] - 1, srt = 45,
     adj = 1, labels = myData$names, xpd = TRUE)
- Error bar
segments(barCenters, myData$mean - myData$se  2, barCenters,
         myData$mean + myData$se  2, lwd = 1.5)
arrows(barCenters, myData$mean - myData$se  2, barCenters,
       myData$mean + myData$se  2, lwd = 1.5, angle = 90,code = 3, length = 0.05)
1.2 按照分组绘制柱状图
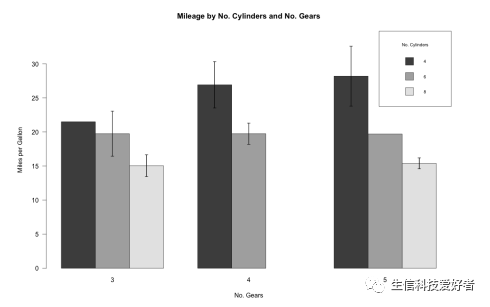
tabbedMeans <- tapply(myData$mean,list(myData$cyl,myData$gears),function(x) c(x = x))
tabbedSE <- tapply(myData$se, list(myData$cyl, myData$gears),function(x) c(x = x))
barCenters <- barplot(height = tabbedMeans,beside = TRUE, las = 1,ylim = c(0, plotTop),
                      cex.names = 0.75,main = "Mileage by No. Cylinders and No. Gears",
                      ylab = "Miles per Gallon",xlab = "No. Gears",border = "black",
                      axes = TRUE,legend.text = TRUE,
                      args.legend = list(title = "No.Cylinders",x = "topright",cex = .7))
segments(barCenters, tabbedMeans-tabbedSE*2, barCenters,tabbedMeans+tabbedSE*2, lwd = 1.5)
arrows(barCenters, tabbedMeans-tabbedSE * 2, barCenters,tabbedMeans+tabbedSE*2,
       lwd = 1.5, angle = 90,code = 3, length = 0.05)
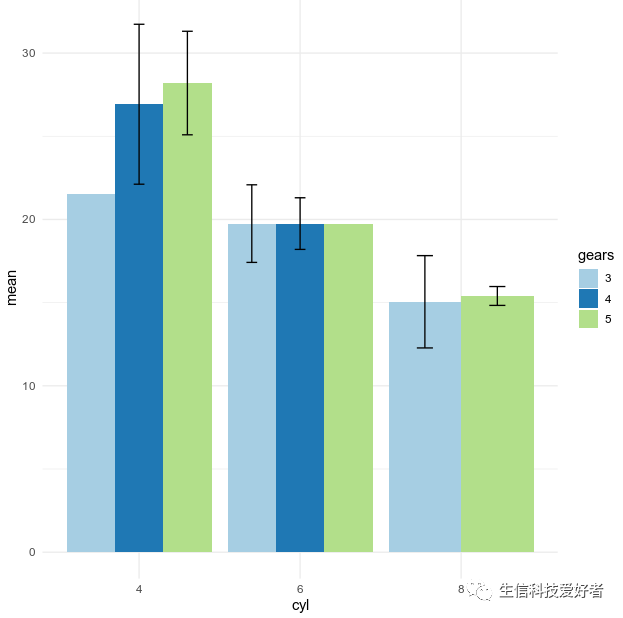
2. ggplot2 包绘带误差线的制柱状图
myData$gears <- as.factor(myData$gears)
ggplot(myData,aes(x=cyl,y=mean,fill=gears)) +
    geom_bar(stat="identity",position=position_dodge()) +
    geom_errorbar(aes(ymin=mean-sd,ymax=mean+sd),width=.2,position=position_dodge(.9)) +
    scale_fill_brewer(palette="Paired") +
    theme_minimal()
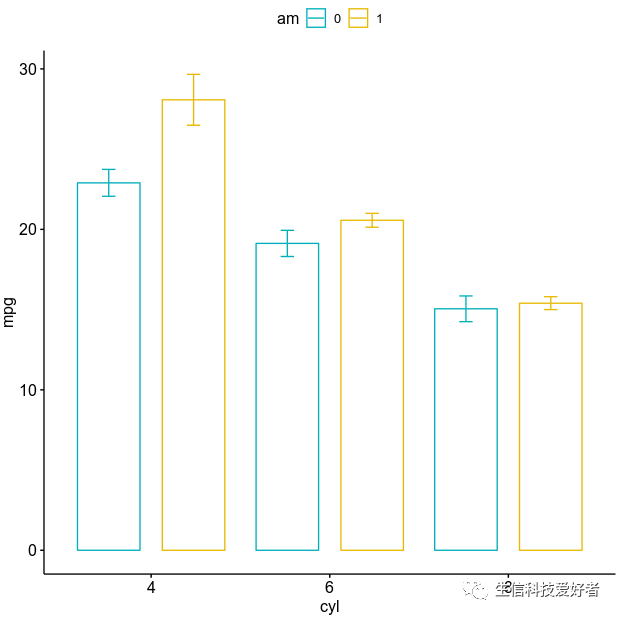
3. ggbarplot 绘制绘带误差线的制柱状图
ggbarplot(mtcars,x="cyl",y="mpg",color="am",add="mean_se",
          palette=c("#00AFBB","#E7B800"), position=position_dodge())
柱状图的介绍就先到这里,其他可替代柱状图的图形包含棒棒糖图(Lollipop)、环形柱状图等未在本文中展开介绍,有兴趣的小伙伴可参考文章最后的参考资料。
三、参考资料
Alboukadel Kassambara,《Bar Plots -R base Graphs》,STHDA
Selva Prabhakaran,《Top 50 ggplot2 Visualizations》,r-statistics.co
Alboukadel Kassambara,《ggpubr: Publication Ready Plots》,STHDA
Alboukadel Kassambara,《Plot Means/Medians and Error Bars》,STHDA
Alboukadel Kassambara,《ggplot2- barplot1》》,STHDA
Winston Chang,《ggplot2- barplot2》,Cookbook for R
Chris Wetherill,《Building Barplots with errorbars》,datascience+
SWD team,《bring on the bar charts — storytelling with data》,storytellingwithdata.com


本文分享自微信公众号 - 生信科技爱好者(bioitee)。
如有侵权,请联系 support@oschina.cn 删除。
本文参与“OSC源创计划”,欢迎正在阅读的你也加入,一起分享。


