Python图表数据可视化Seaborn:4. 结构化图表可视化
1.基本设置
import numpy as np
import pandas as pd
import matplotlib.pyplot as plt
import seaborn as sns
% matplotlib inline

sns.set_style("ticks")
sns.set_context("paper")
# 设置风格、尺度

import warnings
warnings.filterwarnings('ignore')
# 不发出警告
# 1、基本设置
# 绘制直方图

tips = sns.load_dataset("tips")
print(tips.head())
# 导入数据

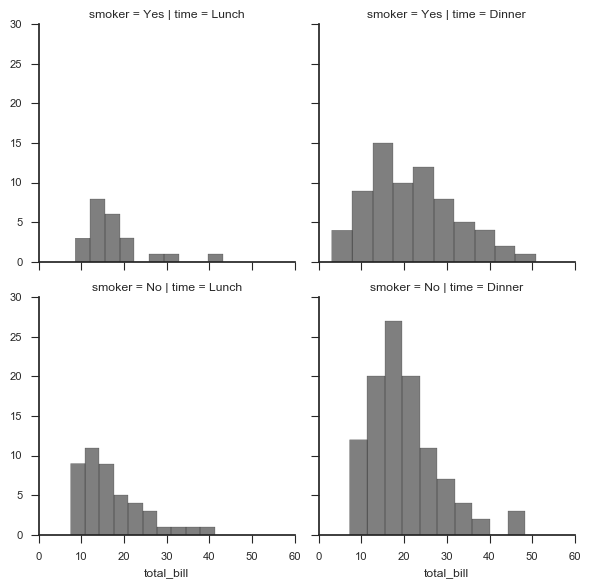
g = sns.FacetGrid(tips, col="time", row="smoker")
# 创建一个绘图表格区域,设置好row、col并分组

g.map(plt.hist, "total_bill",alpha = 0.5,color = 'k',bins = 10)
# 以total_bill字段数据分别做直方图统计

# 1、基本设置
# 绘制直方图

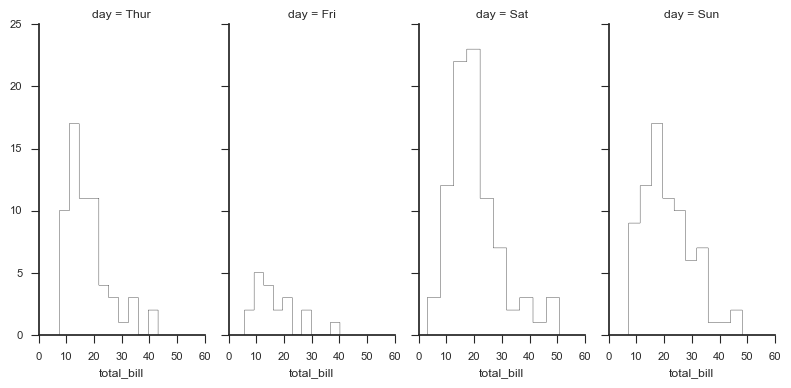
g = sns.FacetGrid(tips, col="day",
                  size=4,    # 图表大小
                  aspect=.5) # 图表长宽比

g.map(plt.hist, "total_bill", bins=10,
      histtype = 'step',   #'bar', 'barstacked', 'step', 'stepfilled'
      color = 'k')
# 1、基本设置
# 绘制散点图

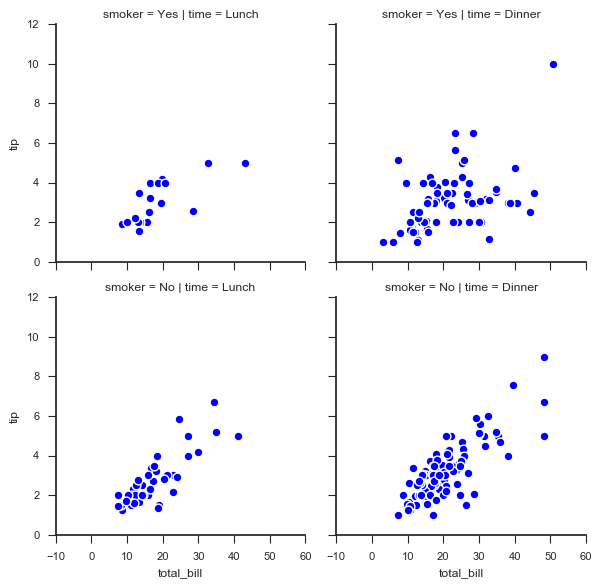
g = sns.FacetGrid(tips, col="time",  row="smoker")
# 创建一个绘图表格区域,设置好row、col并分组

g.map(plt.scatter,
      "total_bill", "tip",    # share{x,y} → 设置x、y数据
      edgecolor="w", s = 40, linewidth = 1)   # 设置点大小,描边宽度及颜色
g.add_legend()
# 添加图例
# 1、基本设置
# 分类

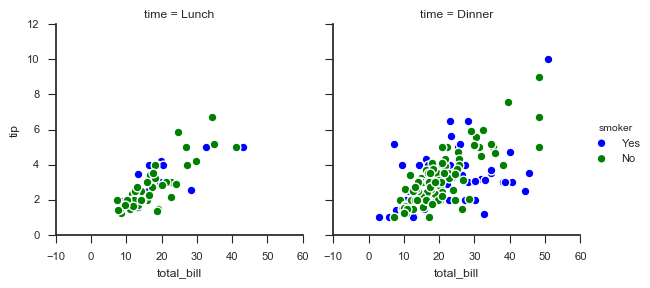
g = sns.FacetGrid(tips, col="time",  hue="smoker")
# 创建一个绘图表格区域,设置好col并分组,按hue分类

g.map(plt.scatter,
      "total_bill", "tip",    # share{x,y} → 设置x、y数据
      edgecolor="w", s = 40, linewidth = 1)   # 设置点大小,描边宽度及颜色
g.add_legend()
# 添加图例
2. 图表矩阵
# 2、图表矩阵

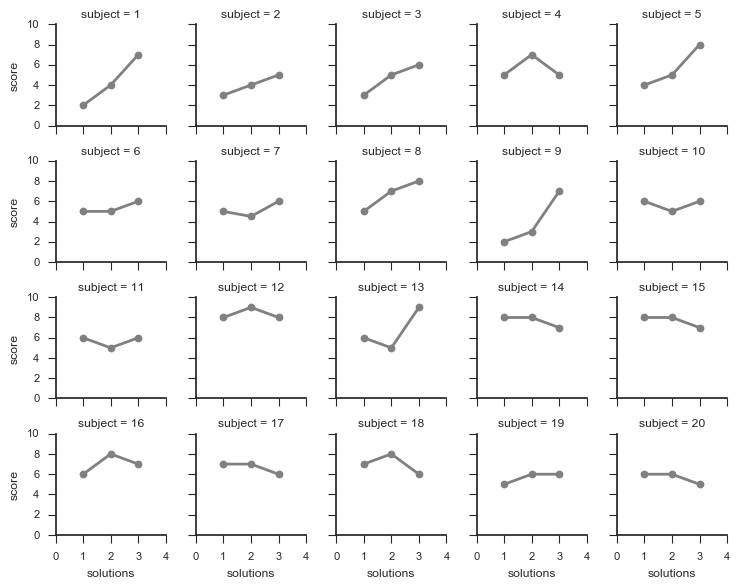
attend = sns.load_dataset("attention")
print(attend.head())
# 加载数据

g = sns.FacetGrid(attend, col="subject", col_wrap=5,   # 设置每行的图表数量
                  size=1.5)
g.map(plt.plot, "solutions", "score",
      marker="o",color = 'gray',linewidth = 2)
# 绘制图表矩阵

g.set(xlim = (0,4),
      ylim = (0,10),
      xticks = [0,1,2,3,4],
      yticks = [0,2,4,6,8,10]
      )
# 设置x,y轴刻度

标签:
python数据分析
, Seaborn


【推荐】国内首个AI IDE,深度理解中文开发场景,立即下载体验Trae
【推荐】编程新体验,更懂你的AI,立即体验豆包MarsCode编程助手
【推荐】抖音旗下AI助手豆包,你的智能百科全书,全免费不限次数
【推荐】轻量又高性能的 SSH 工具 IShell:AI 加持,快人一步
· AI与.NET技术实操系列:向量存储与相似性搜索在 .NET 中的实现
· 基于Microsoft.Extensions.AI核心库实现RAG应用
· Linux系列:如何用heaptrack跟踪.NET程序的非托管内存泄露
· 开发者必知的日志记录最佳实践
· SQL Server 2025 AI相关能力初探
· winform 绘制太阳,地球,月球 运作规律
· 震惊!C++程序真的从main开始吗?99%的程序员都答错了
· 【硬核科普】Trae如何「偷看」你的代码?零基础破解AI编程运行原理
· AI与.NET技术实操系列(五):向量存储与相似性搜索在 .NET 中的实现
· 超详细:普通电脑也行Windows部署deepseek R1训练数据并当服务器共享给他人