
Prometheus概述与部署
Prometheus概述与部署
prometheus是一个开源的
基于指标的监控以及告警系统(包含各种指标收集器、监控、时序数据库、告警),最初由SoundCloud开发
特点
- 多维数据模型,其时间序列数据通过度量指标名称(metrics name)和标签键值对(label)定义
- PromQL,灵活的查询语言,可以对多维数据模型进行查询
- 不依赖分布式存储,单节点就可以独立运行(核心部分只有一个单独的二进制文件,不存在任何第三方依赖)
- 以HTTP方式,通过pull模式来采集时间序列数据
- 支持中间网关(Pushgateway)push模式推送时间序列数据
- 目标(target)通过服务发现或者静态配置发现
- 支持多种模式的图表和仪表板,一般与Grafana(开源的数据可视化工具)结合使用
指标的定义(Metrics)
指标是一个数值度量,时间序列意味着会数据记录会随着时间的推移而变化。用户想要的度量的内容会根据应用的不同而不同。对于web服务器来说可能是请求次数,对于数据库来说可能是连接数或查询次数。
指标是判断应用程序为何以某种方式运行的重要依据,假设正在运行一个web应用程序,发现程序运行很慢,这时需要一些指标来判断原因。比如是请求量高导致的程序变慢,此时有对请求量进行统计的指标的话,就可以发现原因并增加服务器数量处理负载。
架构与组件
Prometheus生态系统
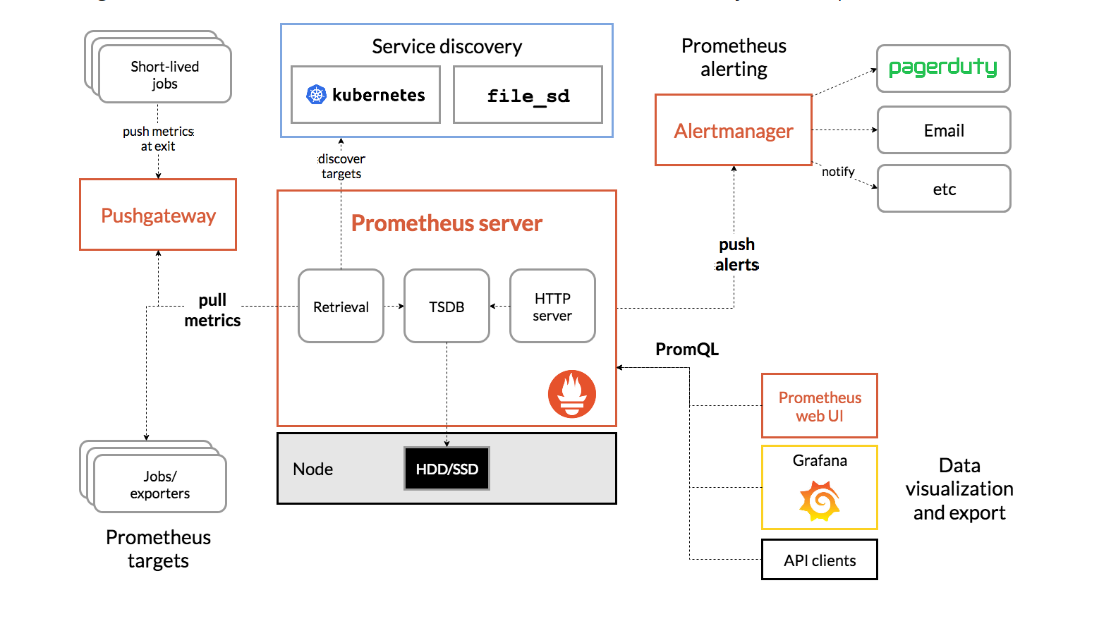
架构层次划分与组件
Prometheus生态系统主要分为三层:数据采集层,数据存储计算层,应用层
1.数据采集层
Pushgateway,exporter
- 跨网段采集的数据指标先推送(push)给Pushgateway,等待Retrieval组件拉取(pull)指标数据
- 非跨网段采集的数据指标,Retrieval组件直接从指标采集器(exporters)中拉取(pull)指标数据
2.数据存储计算层
Prometheus server(Retrieval、TSDB、HTTP server),Service discovery
- Prometheus Server:prometheus核心服务,包含存储引擎与计算引擎
- Retrieval:主动从Pushgateway或Exporter中拉取指标数据
- TSDB(时序数据库):数据核心存储与查询
- HTTP server:对外提供HTTP服务
- Service discovery:动态发现监控目标
3.应用层
数据可视化(Prometheus web UI、Grafana),AlertManager(监控报警系统)
- AlertManager:监控报警系统,将应用异常信息推送给用户
- 数据可视化:Prometheus web UI(Prometheus自带的UI页面,默认端口9090)、Grafana(开源的数据可视化工具,推荐结合Grafana实现数据可视化)
数据模型与指标类型
数据模型
数据模型由指标名称(Metric names)和标签(label,kv形式)组成
格式:
<metric name>{<label name>=<label value>, ...}
eg:
node_filesystem_size_bytes{device="/dev/sda1",fstype="xfs",mountpoint="/boot"}
样本
Prometheus会将所有采集到的样本数据以时间序列(time-series)的方式保存在内存数据库中,并定时保存到硬盘上。时间序列是按照时间戳和值的序列顺序存放的,每一条time-series通过指标名称与一组标签集组成。时间序列中的每一个点称为一个样本
一个样本由三部分组成:
- 指标:指标名与标签
- 时间戳:一个精确到毫秒的时间戳
- 样本值:一个float64的浮点型数据
指标类型
指标类型分为四种:Counter(计算器类型)、Gauge(仪表盘类型)、Histogram(直方图类型)、Summary(摘要类型)
-
Counter:计数器,是一个累计的度量,此值会一直增加,只在重启时重置为0
eg: # HELP node_forks_total Total number of forks. # TYPE node_forks_total counter node_forks_total 4258 -
Gauge:表示单个数值的度量,可以增加与减少
eg: # HELP node_filesystem_avail_bytes Filesystem space available to non-root users in bytes. # TYPE node_filesystem_avail_bytes gauge node_filesystem_avail_bytes{device="/dev/sda1",fstype="xfs",mountpoint="/boot"} 1.51687168e+08 node_filesystem_avail_bytes{device="/dev/sda3",fstype="xfs",mountpoint="/"} 8.413765632e+09 node_filesystem_avail_bytes{device="tmpfs",fstype="tmpfs",mountpoint="/run"} 5.009408e+08 node_filesystem_avail_bytes{device="tmpfs",fstype="tmpfs",mountpoint="/run/user/0"} 1.01957632e+08 node_filesystem_avail_bytes{device="tmpfs",fstype="tmpfs",mountpoint="/run/user/42"} 1.01945344e+08 -
Histogram:用于表示一段时间范围内对数据进行采样,并在指定区间以及总数进行统计,通常采集的数据展示为直方图,将整个测量范围划分为一组区间,称为桶,并计算每个桶中有多少测量值
一个直方图指标包含三个项目: 1.包含测量次数的Counter,指标名称使用_count后缀 2.包含所有测量值之和的Counter,指标名称使用_sum后缀 3.直方图被暴露为一系列的Counter,指标名称使用_bucket后缀,标签使用le字段表示桶的上限。桶包含桶的边界的,即一个上限为N的桶包含所有数值小于或等于N的数据点 eg: # HELP http_request_duration_seconds Api requests response time in seconds # TYPE http_request_duration_seconds histogram http_request_duration_seconds_sum{api="add_product" instance="host1.domain.com"} 8953.332 http_request_duration_seconds_count{api="add_product" instance="host1.domain.com"} 27892 http_request_duration_seconds_bucket{api="add_product" instance="host1.domain.com" le="0"} http_request_duration_seconds_bucket{api="add_product", instance="host1.domain.com", le="0.01"} 0 http_request_duration_seconds_bucket{api="add_product", instance="host1.domain.com", le="0.025"} 8 http_request_duration_seconds_bucket{api="add_product", instance="host1.domain.com", le="0.05"} 1672 http_request_duration_seconds_bucket{api="add_product", instance="host1.domain.com", le="0.1"} 8954 http_request_duration_seconds_bucket{api="add_product", instance="host1.domain.com", le="0.25"} 14251 http_request_duration_seconds_bucket{api="add_product", instance="host1.domain.com", le="0.5"} 24101 http_request_duration_seconds_bucket{api="add_product", instance="host1.domain.com", le="1"} 26351 http_request_duration_seconds_bucket{api="add_product", instance="host1.domain.com", le="2.5"} 27534 http_request_duration_seconds_bucket{api="add_product", instance="host1.domain.com", le="5"} 27814 http_request_duration_seconds_bucket{api="add_product", instance="host1.domain.com", le="10"} 27881 http_request_duration_seconds_bucket{api="add_product", instance="host1.domain.com", le="25"} 27890 http_request_duration_seconds_bucket{api="add_product", instance="host1.domain.com", le="+Inf"} 27892 -
Summary:与直方图类似,用于表示一段时间范围内对数据进行采样,并在指定区间以及总数进行统计
一个Summary指标包含三个项目:
1.包含测量次数的Counter,指标名称使用_count后缀
2.包含所有测量值之和的Counter,指标名称使用_sum后缀
3.使用带有分位数标签的指标名称(quantile),来暴露一些测量值的分位数指标,分位数中0表示最小值,1表示最大值,0.5表示中位数

eg:
# HELP go_gc_duration_seconds A summary of the pause duration of garbage collection cycles.
# TYPE go_gc_duration_seconds summary
go_gc_duration_seconds{quantile="0"} 1.3784e-05
go_gc_duration_seconds{quantile="0.25"} 2.0578e-05
go_gc_duration_seconds{quantile="0.5"} 2.2778e-05
go_gc_duration_seconds{quantile="0.75"} 2.7885e-05
go_gc_duration_seconds{quantile="1"} 6.203e-05
go_gc_duration_seconds_sum 0.000478522
go_gc_duration_seconds_count 18
linux环境下部署node_exporter+prometheus+grafana实现对服务器状态数据进行监控
node_exporter下载
负责对服务器状态的指标数据进行采集,服务默认端口9100
官方下载网址:https://prometheus.io/download/
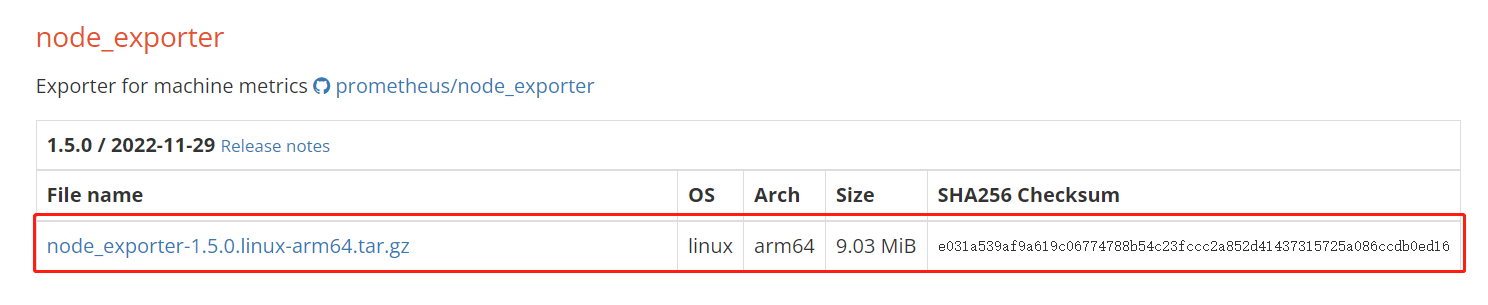
下载的版本:node_exporter-1.5.0.linux-arm64.tar.gz
prometheus server下载
负责数据存储与计算,服务默认端口9090
官方下载网址:https://prometheus.io/download/
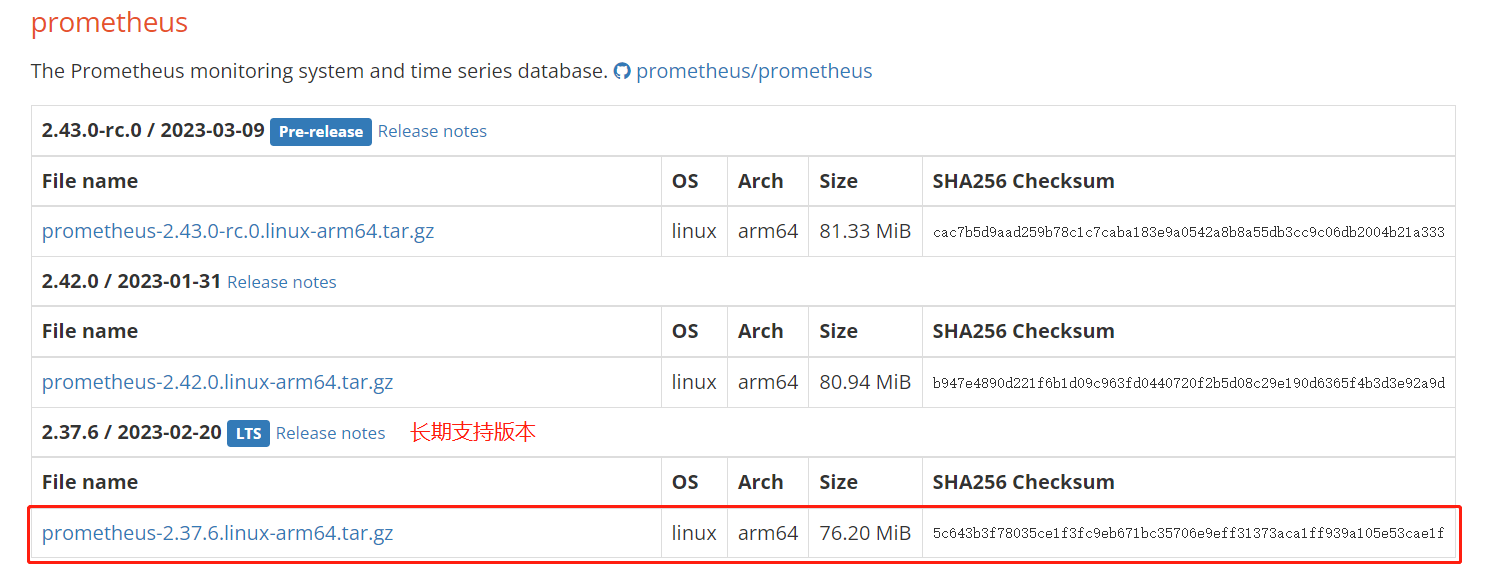
下载的是长期支持版本:prometheus-2.37.6.linux-amd64.tar.gz
grafana下载
开源的数据可视化工具,服务默认端口3000
官方下载网址:https://grafana.com/grafana/download?pg=get&plcmt=selfmanaged-box1-cta1
总共有三个版本:Grafana OSS(开源版),Grafana Enterprise(企业版本),Grafana Cloud(云版)
其中企业版是默认和推荐的版本,它包含开源版本的所有功能可以免费使用,也可以升级到完整的企业版(收费)
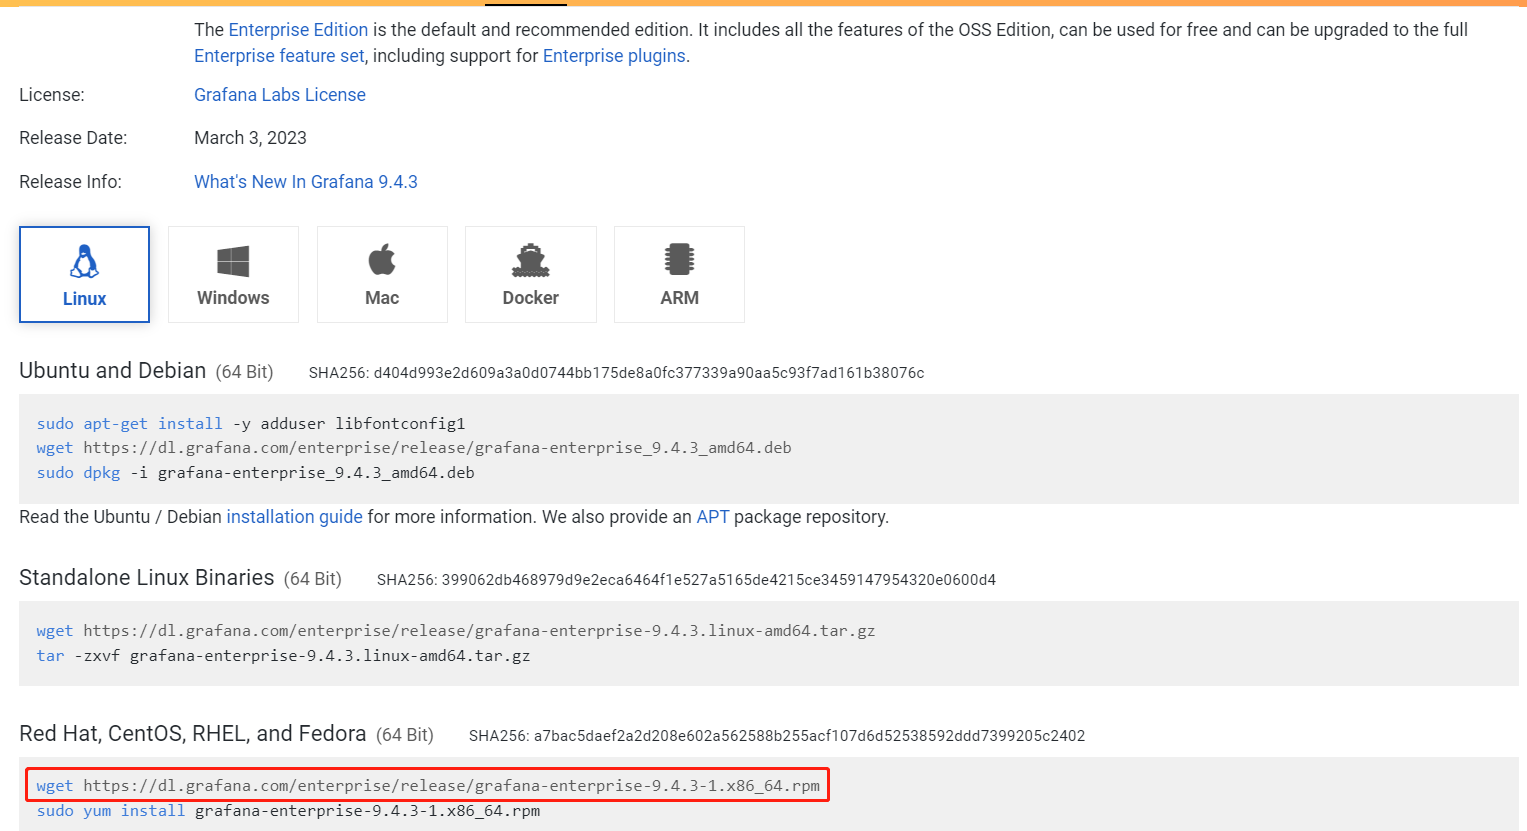
这里下载的是企业版的rpm包:grafana-enterprise-9.4.3-1.x86_64.rpm
安装node_exporter+prometheus+grafana的服务器状态监控系统
1.将压缩包与rpm上传至服务器

2.安装node_exporter并启动服务
解压压缩包
tar -zxvf node_exporter-1.5.0.linux-amd64.tar.gz
得到文件夹node_exporter-1.5.0.linux-amd64
进入node_exporter-1.5.0.linux-amd64文件夹中,运行node_exporter服务(默认端口9100),收集服务器状态的指标数据
cd node_exporter-1.5.0.linux-amd64
./node_exporter
3.安装prometheus
解压压缩包
tar -zxvf prometheus-2.37.6.linux-amd64.tar.gz
得到文件夹prometheus-2.37.6.linux-amd64
4.修改prometheus的配置文件(通过静态配置发现node_exporter)
进入prometheus-2.37.6.linux-amd64文件夹中
修改配置文件prometheus.yml,添加新目标node_exporter
vi prometheus.yml
配置文件内容如下:
# my global config
global:
  scrape_interval: 15s # Set the scrape interval to every 15 seconds. Default is every 1 minute.
  evaluation_interval: 15s # Evaluate rules every 15 seconds. The default is every 1 minute.
  # scrape_timeout is set to the global default (10s).

# Alertmanager configuration
alerting:
  alertmanagers:
    - static_configs:
        - targets:
          # - alertmanager:9093

# Load rules once and periodically evaluate them according to the global 'evaluation_interval'.
rule_files:
  # - "first_rules.yml"
  # - "second_rules.yml"

# A scrape configuration containing exactly one endpoint to scrape:
# Here it's Prometheus itself.
scrape_configs:
  # The job name is added as a label `job=<job_name>` to any timeseries scraped from this config.
  - job_name: "prometheus"

    # metrics_path defaults to '/metrics'
    # scheme defaults to 'http'.

    static_configs:
      - targets: ["localhost:9090"]
  #新添加的目标
  - job_name: "node_exporter"

    # metrics_path defaults to '/metrics'
    # scheme defaults to 'http'.

    static_configs:
      - targets: ["localhost:9100"]
5.运行prometheus服务,检测服务上线情况
运行prometheus服务
./prometheus --config.file=prometheus.yml
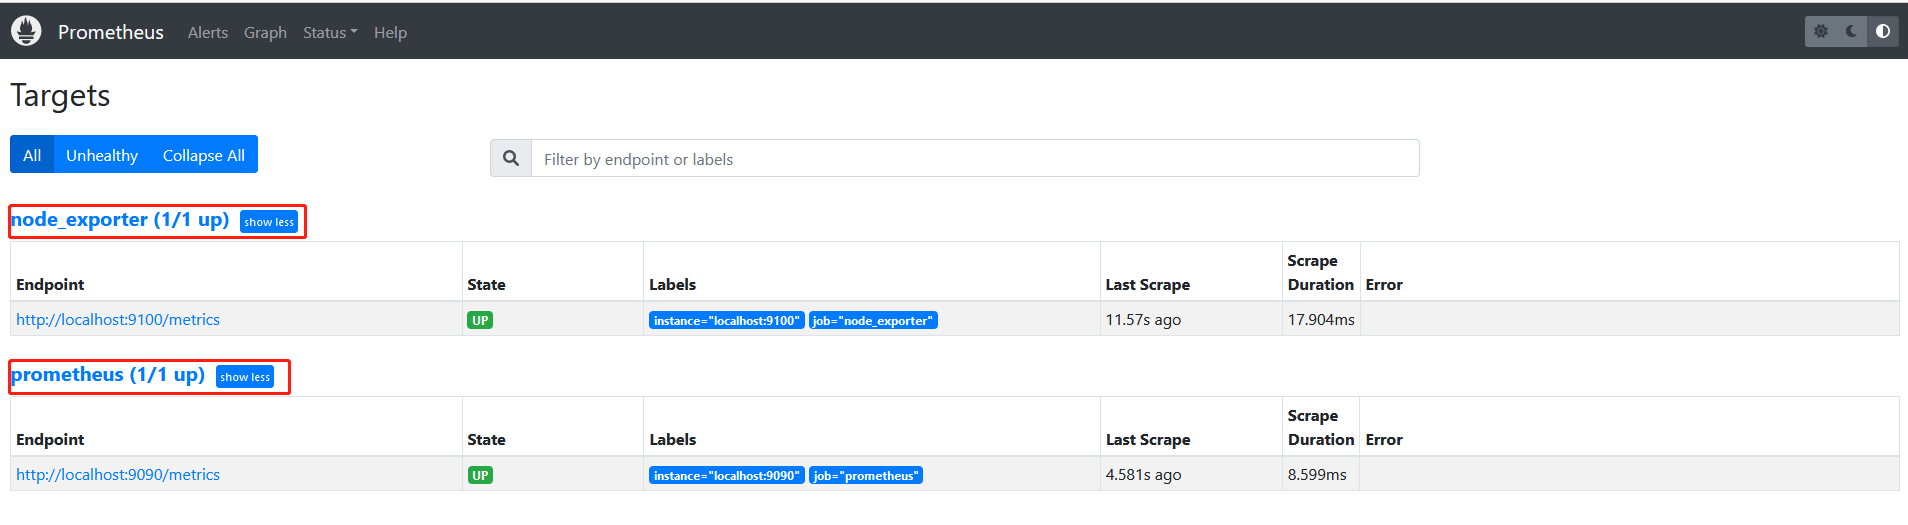
两个服务正常运行后,登陆prometheus页面http://ip:9090
菜单栏选择Status->Targets,发现node_exporter与prometheus已上线
6.安装grafana并启动服务
安装grafana-rpm包
rpm -ivh grafana-enterprise-9.4.3-1.x86_64.rpm
===
有可能会显示缺少urw-fonts依赖,需要下载相关依赖
下载网址:https://pkgs.org/download/urw-fonts
下载得到rpm包urw-fonts-2.4-16.el7.noarch.rpm
rpm -ivh urw-fonts-2.4-16.el7.noarch.rpm
===
启动服务并查看服务状态
systemctl daemon-reload
systemctl start grafana-server
systemctl status grafana-server
设置开启自启动
systemctl enable grafana-server

默认的日志路径:/var/log/grafana/grafana.log
systemd service:grafana-server.service
服务状态正常的情况下,登陆grafana页面http://ip:3000
账号密码默认是admin
登陆后的页面如下:

7.添加数据源
设置->配置->Add new data source
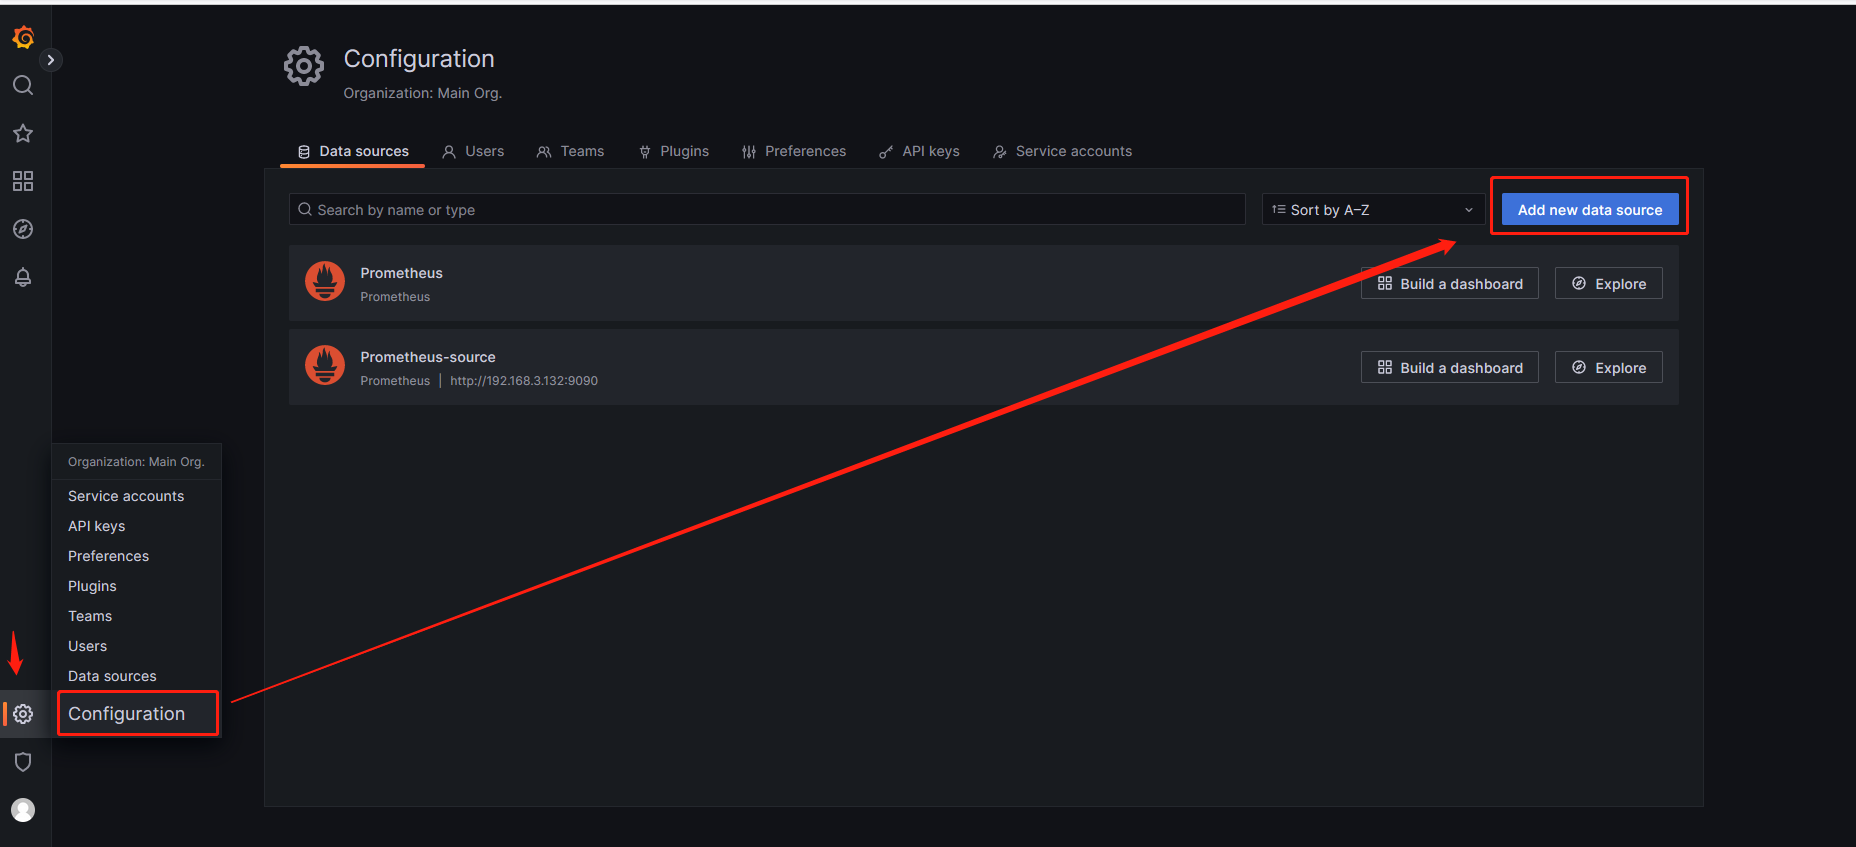
数据源选择prometheus,添加数据源网址(prometheus路径)

8.导入仪表板
针对node_exporter收集到的指标数据,有对应的仪表板(对应的promQL命令能够查询到对应的指标数据)。
grafana仪表板页面:https://grafana.com/grafana/dashboards/?plcmt=footer
选择node_exporter对应的仪表板-Node Exporter Full
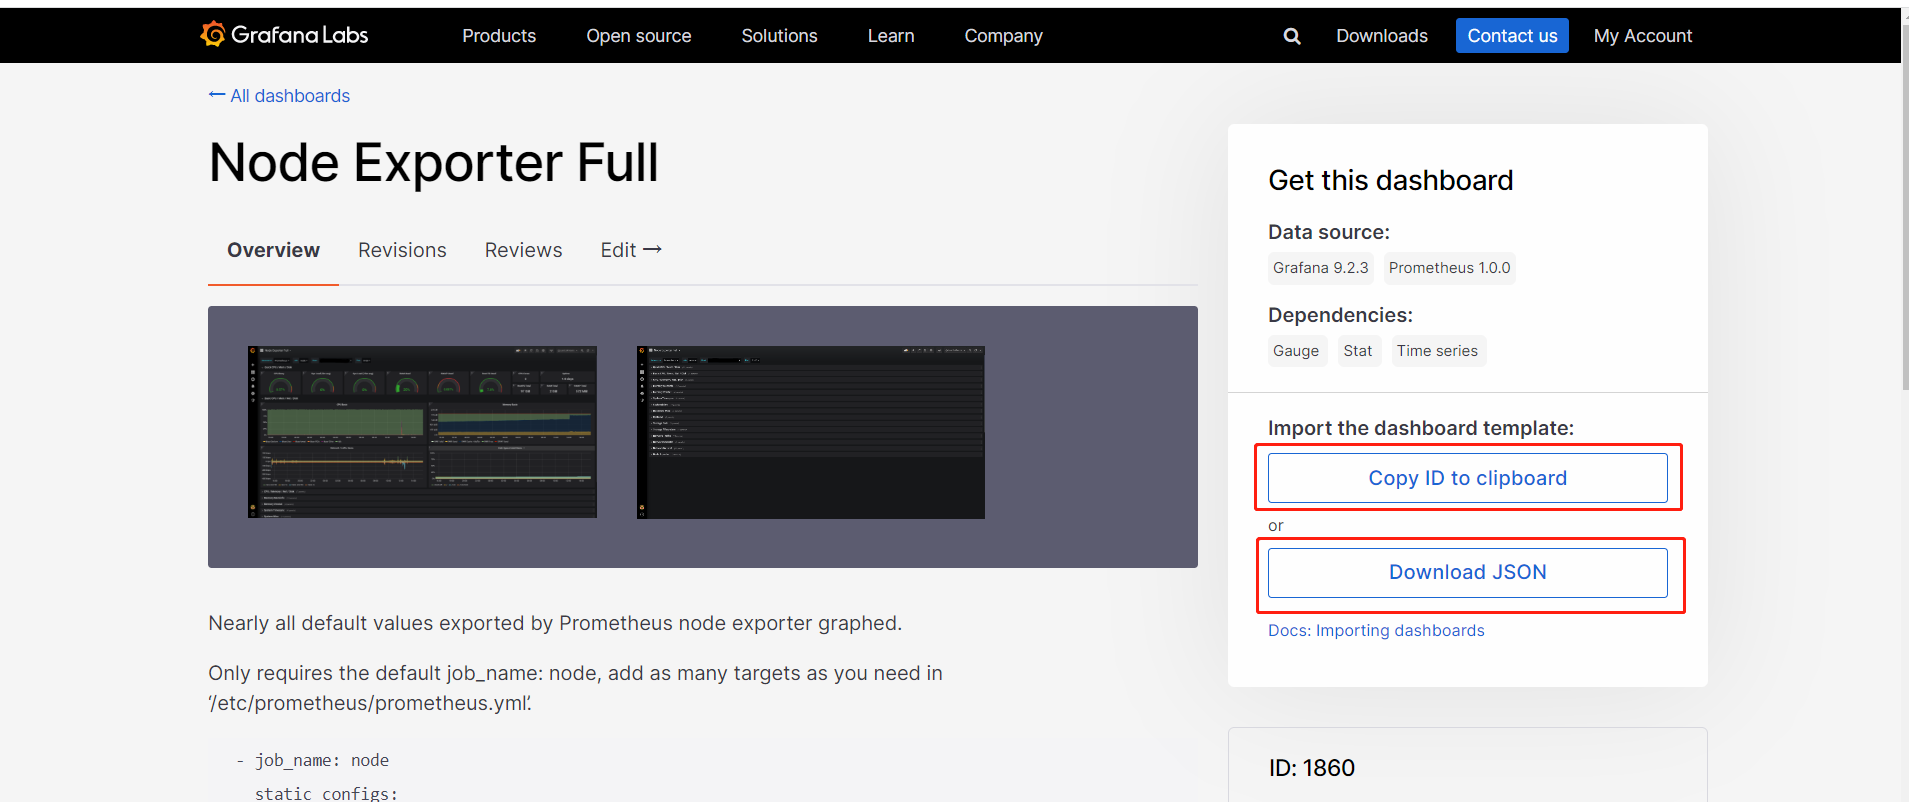
通过仪表板的json文件或ID进行导入(离线的话导入json文件)

选择之前创建成功的数据源(Prometheus-source)
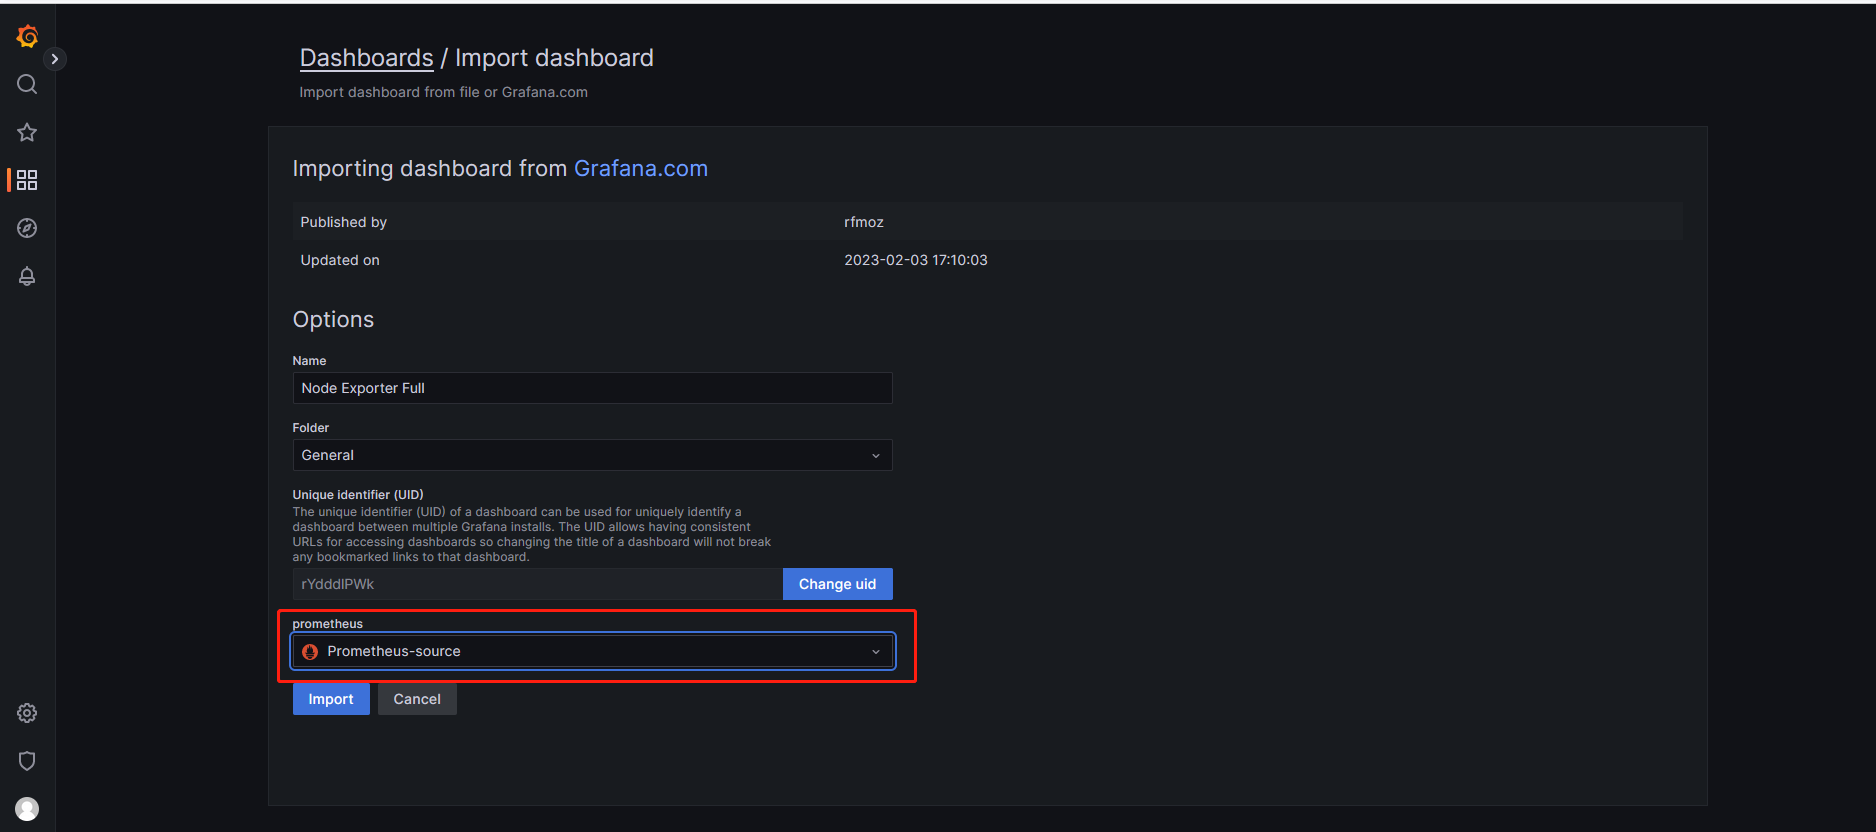
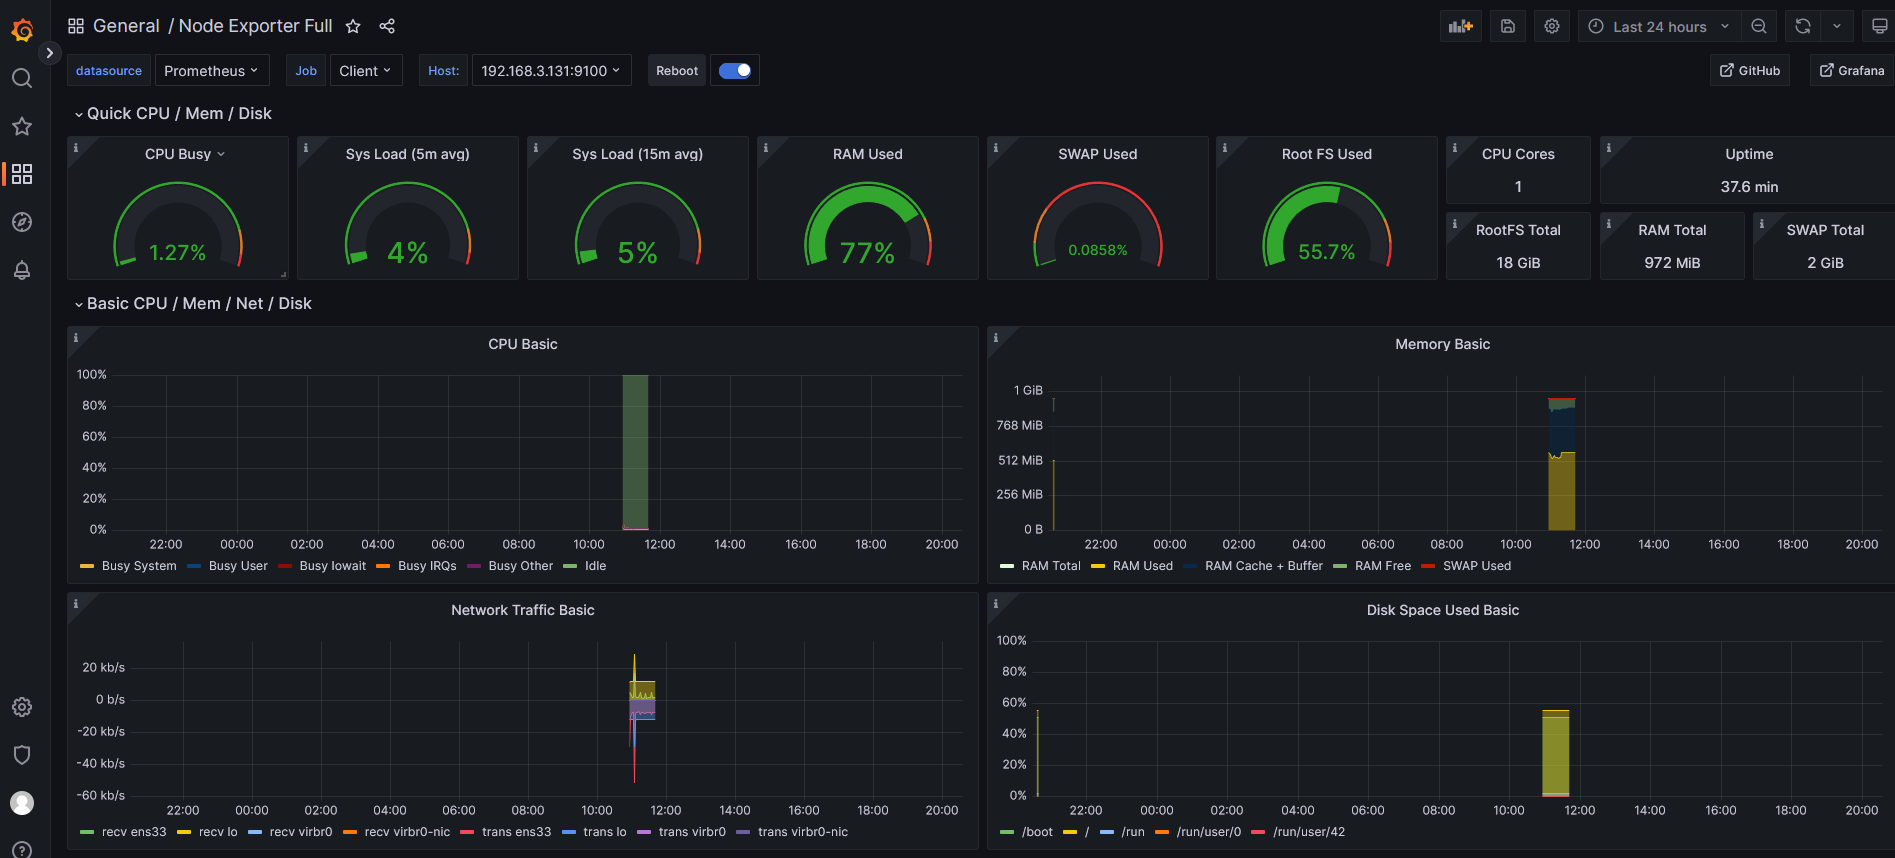
导入成功的页面如下:
参考网址
Prometheus官方文档网址:https://prometheus.io/docs/introduction/overview/
Grafana官方文档网址:https://grafana.com/docs/grafana/latest/
https://andyoung.blog.csdn.net/article/details/122056239
https://www.bilibili.com/read/cv13298406?spm_id_from=333.999.0.0

 浙公网安备 33010602011771号