matplotlib绘制子图
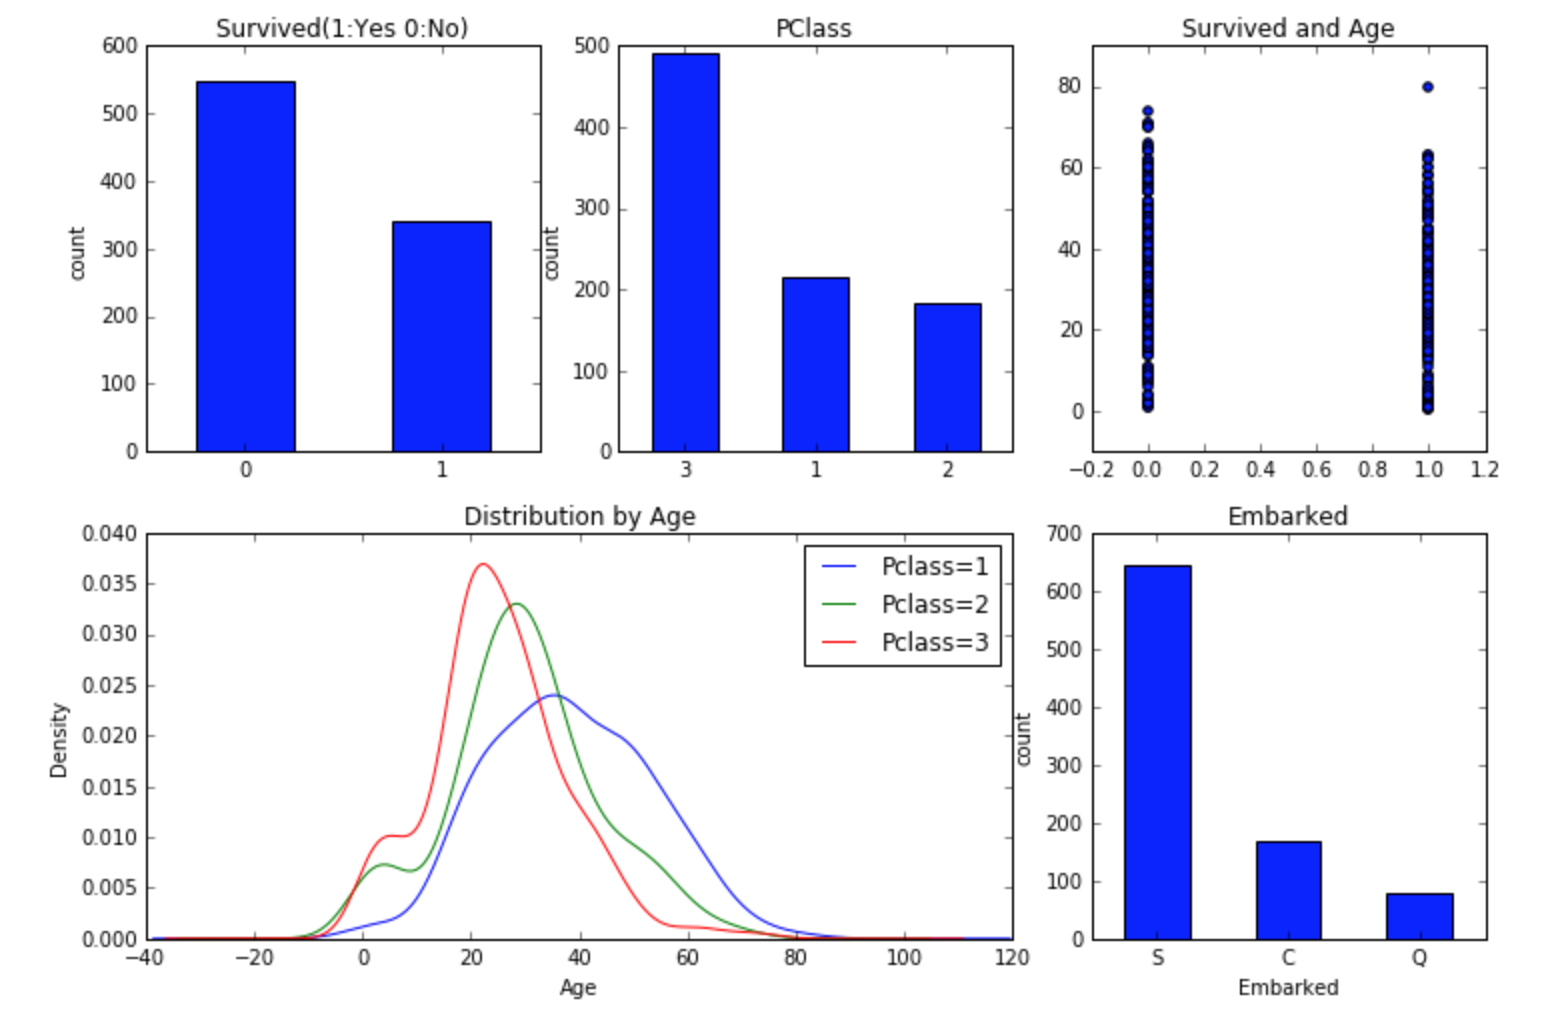
在python数据分析中,我们会经常用到matplotlib模块绘制多个子图,如何个性化子图的布局,下面利用Kaggle中的Titanic数据介绍两种方法。
import pandas as pd
import numpy as np

df_train = pd.read_csv("train.csv")
df_train.head()

1. subplot2grid()
subplot2grid(shape, loc, rowspan=1, colspan=1, fig=None, **kwargs)
import matplotlib.pyplot as plt

fig = plt.figure(figsize=(12, 8))

# 获救情况
plt.subplot2grid((2,3), (0,0))
df_train['Survived'].value_counts().plot(kind='bar')
plt.title("Survived(1:Yes 0:No)")
plt.ylabel("count")
plt.xticks(rotation = 0)

# 仓位等级
plt.subplot2grid((2,3), (0,1))
df_train['Pclass'].value_counts().plot.bar()
plt.title("PClass")
plt.ylabel("count")
plt.xticks(rotation = 0)

# 年龄
plt.subplot2grid((2,3), (0,2))
plt.scatter(df_train.Survived, df_train.Age)
plt.title("Survived and Age")
plt.xticks(rotation = 0)

# 仓位等级对应年龄密度曲线
plt.subplot2grid((2,3), (1,0), colspan=2)
df_train.Age[df_train.Pclass == 1].plot.kde()
df_train.Age[df_train.Pclass == 2].plot.kde()
df_train.Age[df_train.Pclass == 3].plot.kde()
plt.xlabel("Age")
plt.ylabel("Density")
plt.title("Distribution by Age")
plt.legend(('Pclass=1', 'Pclass=2','Pclass=3'), loc='best') # sets our legend for our graph.

# 登陆港口
plt.subplot2grid((2,3), (1,2))
df_train.Embarked.value_counts().plot.bar()
plt.title("Embarked")
plt.xlabel("Embarked")
plt.ylabel("count")
plt.xticks(rotation = 0)

plt.tight_layout()

2. gridspec
GridSpec(nrows, ncols, figure=None, left=None, bottom=None, right=None, top=None, wspace=None, hspace=None, width_ratios=None, height_ratios=None)
下面代码将会得到和上面同样的图形。
import matplotlib.pyplot as plt
import matplotlib.gridspec as gridspec

fig = plt.figure(figsize=(12, 8))
spec = gridspec.GridSpec(ncols=3, nrows=2)

# 获救情况
ax1 = fig.add_subplot(spec[0, 0])
df_train['Survived'].value_counts().plot(kind='bar')
plt.title("Survived(1:Yes 0:No)")
plt.ylabel("count")
plt.xticks(rotation = 0)

# 仓位等级
ax2 = fig.add_subplot(spec[0, 1])
plt.subplot2grid((2,3), (0,1))
df_train['Pclass'].value_counts().plot.bar()
plt.title("PClass")
plt.ylabel("count")
plt.xticks(rotation = 0)

# 年龄
ax3 = fig.add_subplot(spec[0, 2])
plt.scatter(df_train.Survived, df_train.Age)
plt.title("Survived and Age")
plt.xticks(rotation = 0)

# 仓位等级对应年龄密度曲线
ax4 = fig.add_subplot(spec[1, 0:2])
df_train.Age[df_train.Pclass == 1].plot.kde()
df_train.Age[df_train.Pclass == 2].plot.kde()
df_train.Age[df_train.Pclass == 3].plot.kde()
plt.xlabel("Age")
plt.ylabel("Density")
plt.title("Distribution by Age")
plt.legend(('Pclass=1', 'Pclass=2','Pclass=3'), loc='best')

# 登陆港口
ax5 = fig.add_subplot(spec[1, 2])
df_train.Embarked.value_counts().plot.bar()
plt.title("Embarked")
plt.xlabel("Embarked")
plt.ylabel("count")
plt.xticks(rotation = 0)

fig.tight_layout()


 浙公网安备 33010602011771号