【R语言学习笔记】6. 运用ggplot2包进行数据可视化----基于鸢尾花卉(iris)数据集
1. 摘要:基于鸢尾花卉(iris)数据集来练习运用ggplot2进行数据可视化。
2. 数据来源:R语言内置数据集

3. 练习
3.1 基于原数据集以及整合数据集
1 2 3 4 5 | # Aggregate the first four column by Species and calculate the meaniris.summary <- aggregate(iris[1:4], list(iris$Species), mean)# Change the name of the first column to 'Species'names(iris.summary)[1] <- 'Species' |

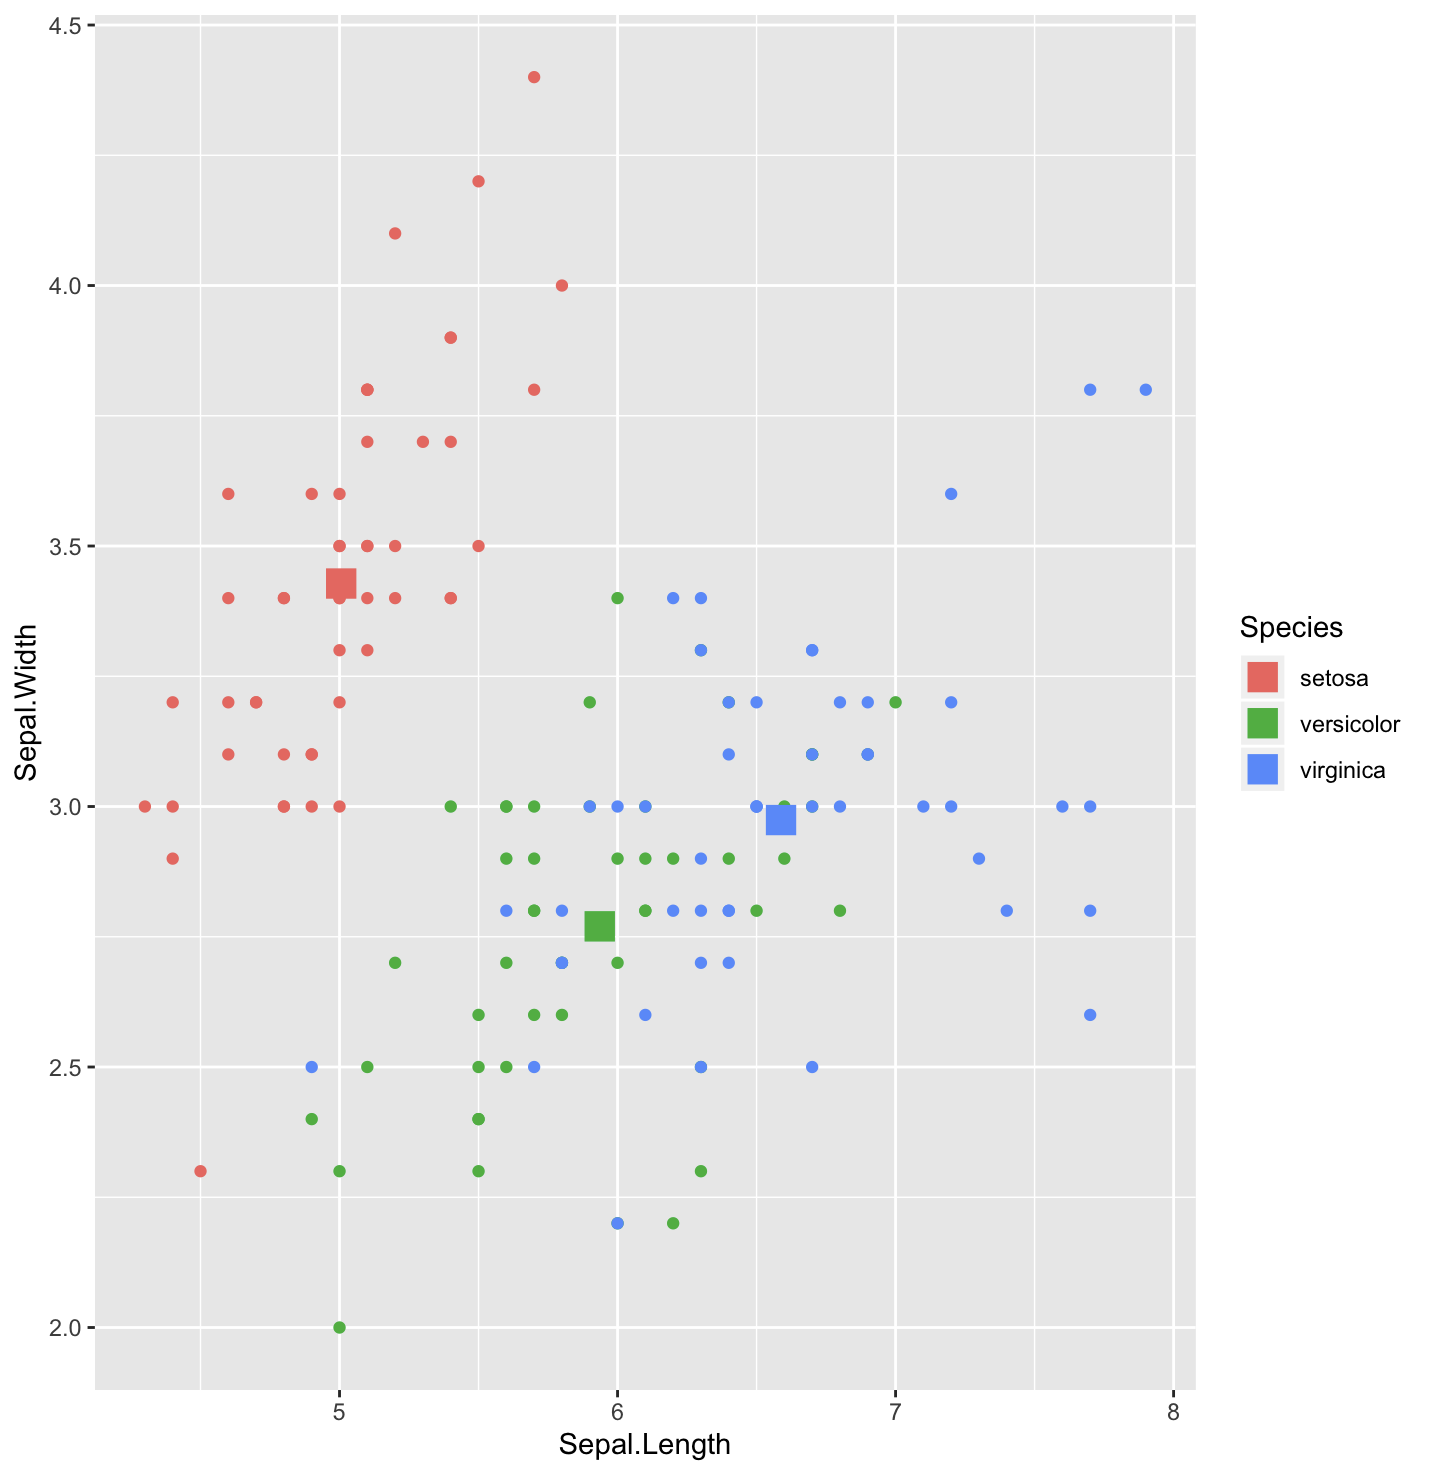
1 2 | library(ggplot2) # load the ggplot2 packageggplot(iris, aes(x = Sepal.Length, y = Sepal.Width, col = Species)) + geom_point() + geom_point(data = iris.summary, shape = 15, size = 5) |

1 2 3 | ggplot(iris, aes(x = Sepal.Length, y = Sepal.Width, col = Species)) + geom_point() + geom_vline( data = iris.summary, linetype = 2, aes(xintercept = Sepal.Length, col = Species)) + geom_hline( data = iris.summary, linetype = 2, aes(yintercept = Sepal.Width, col = Species)) |

3.2 基于清洗的数据集
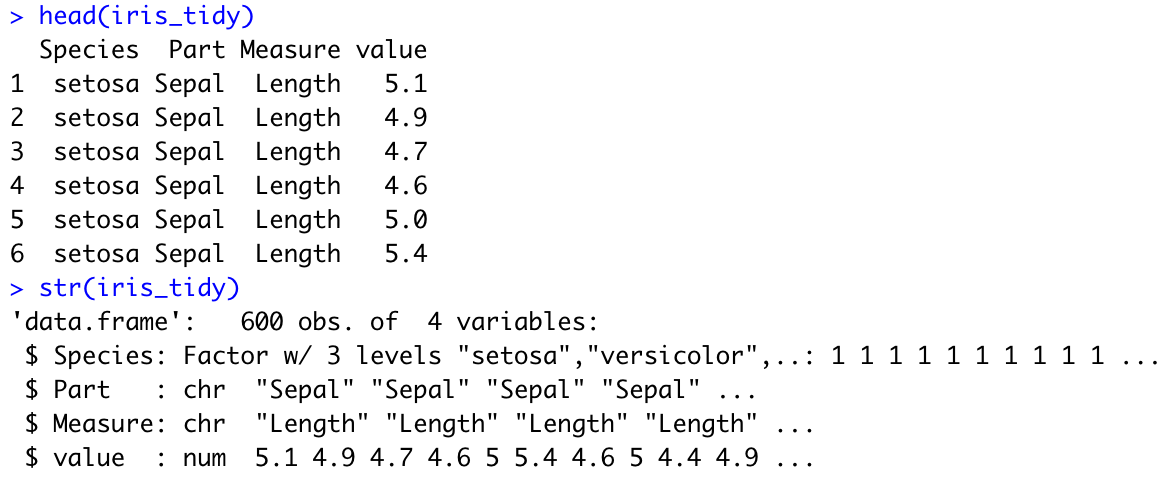
1 2 3 4 5 6 7 | library(tidyr) # load tidyr package #iris.tidy----data frome formatiris_tidy <- iris %>% gather(key, value, -Species) %>% separate(key, c('Part', 'Measure'), '\\.')head(iris_tidy)str(iris_tidy) |

1 | ggplot(iris_tidy, aes(x = Species, y = value, col = Part)) + geom_jitter() + facet_grid(. ~ Measure) |

1 2 3 4 5 6 7 | #iris.wideiris_wide <- iris %>% gather(key, value, -Species, -id) %>% separate(key, c('Part', 'Measure'), '\\.') %>% spread(Measure, value)head(iris_wide)str(iris_wide) |

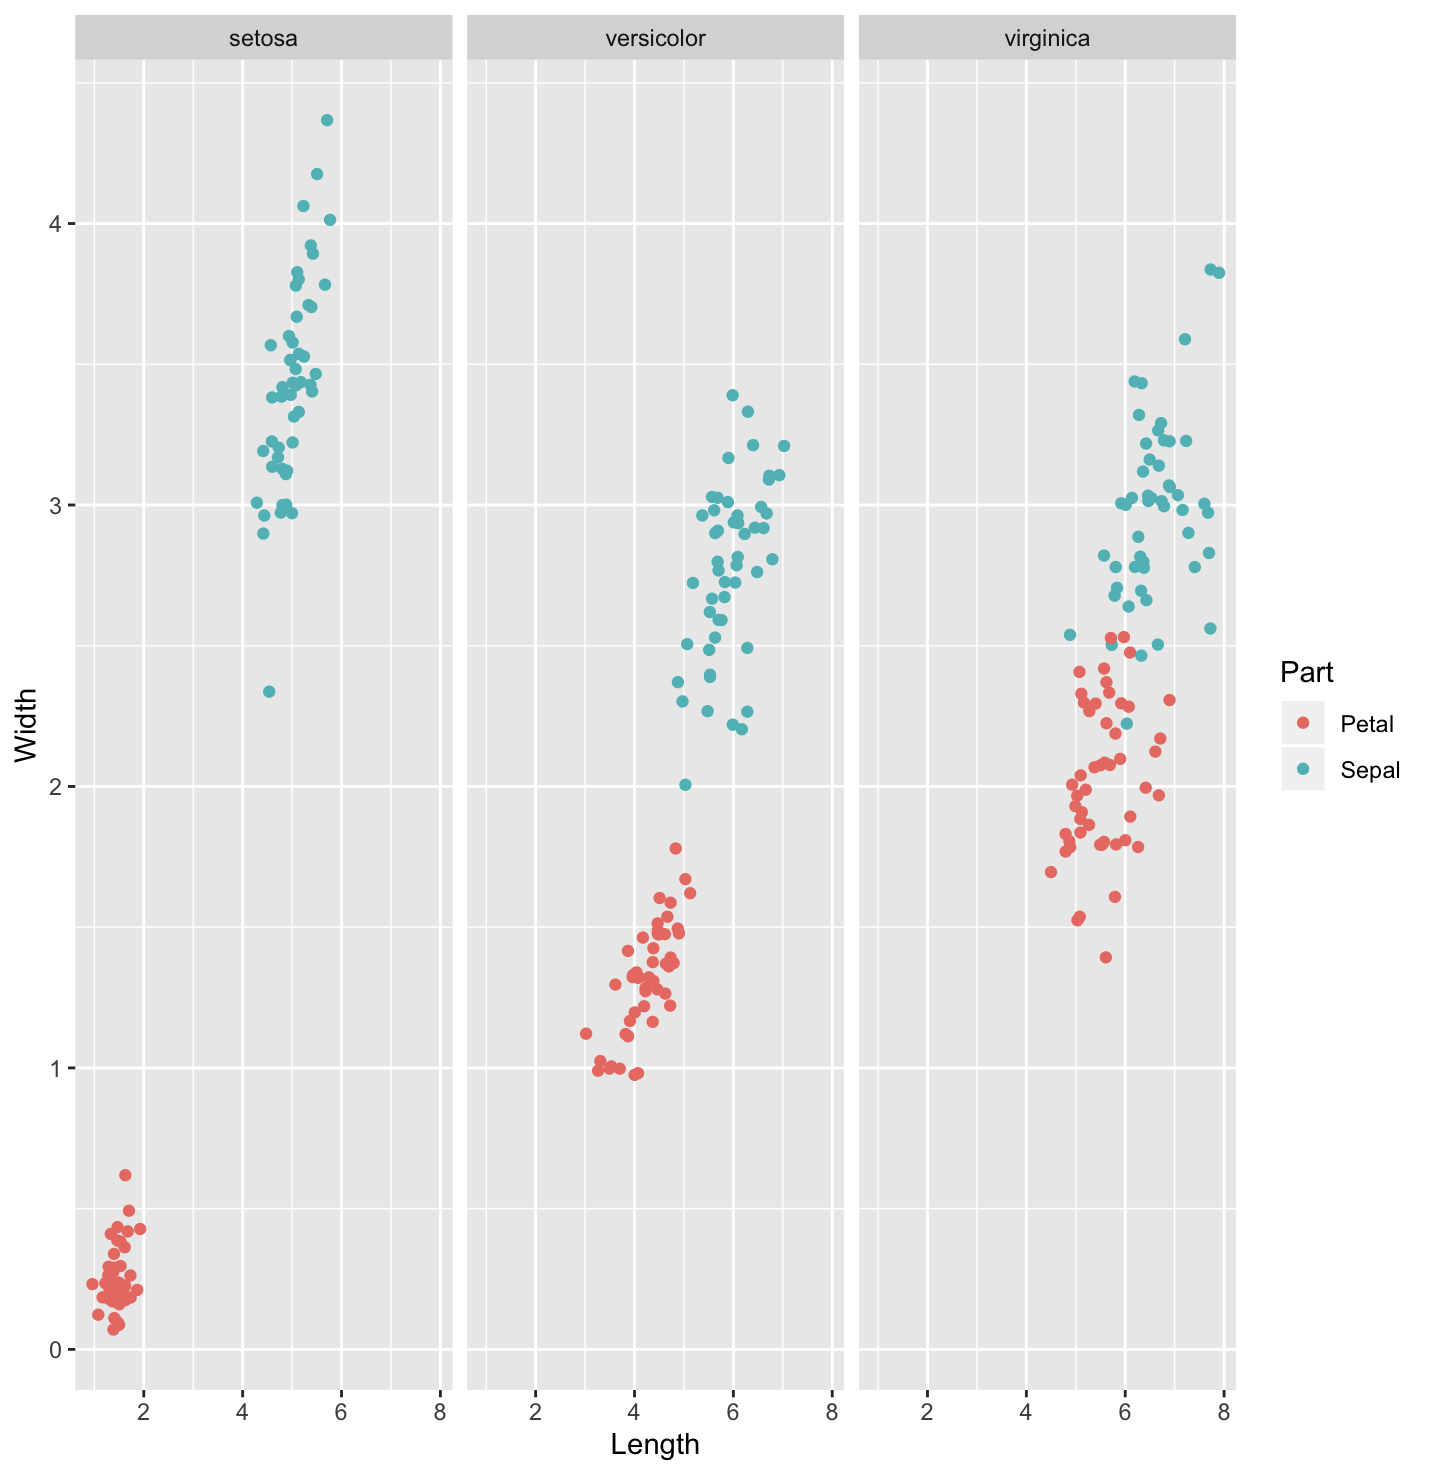
1 | ggplot(iris_wide, aes(x = Length, y = Width, color = Part)) + geom_jitter() + facet_grid(. ~ Species) |


· [.NET]调用本地 Deepseek 模型
· 一个费力不讨好的项目,让我损失了近一半的绩效!
· .NET Core 托管堆内存泄露/CPU异常的常见思路
· PostgreSQL 和 SQL Server 在统计信息维护中的关键差异
· C++代码改造为UTF-8编码问题的总结
· CSnakes vs Python.NET:高效嵌入与灵活互通的跨语言方案对比
· 【.NET】调用本地 Deepseek 模型
· Plotly.NET 一个为 .NET 打造的强大开源交互式图表库
· 上周热点回顾(2.17-2.23)
· 如何使用 Uni-app 实现视频聊天(源码,支持安卓、iOS)