

使用g6(antdV-g6)实现简单的逻辑脑图(react、G6、antdV)
使用g6(antdV-g6)实现简单的逻辑脑图
现在我们有一个需求:要求我们把相互关联的数据实现成脑图或者是树图;
1.需求分析
那么我们要实现这个功能,首先我们应该干什么?
第一步当然是思考怎么能把我们的数据实现成脑图,既然我们要画脑图,那么我们必然会需要我们学过的canvas或者是svg。
那我们,光知道这两个东西能实现画脑图,我们要怎么把它实现出来能?这就会有许多的问题会等待着我们去解决。。。
比如怎么画一个长方形,怎么画一个正方形,怎么画一条线,怎么让一条线连着有关联的点,等等一系列的问题。所以我们为何不找找现成的东西,拿来用,何不快哉!
2.调研
所以什么样的组件能帮我们实现这个功能呢?
2.1relation-graph
官网地址:
这个确实能实现我们的需求,但是出处不明,最后我还是选择了大厂的。这里没有贬低的意思,而是产品中的需求需要一个更稳定更新的产品。
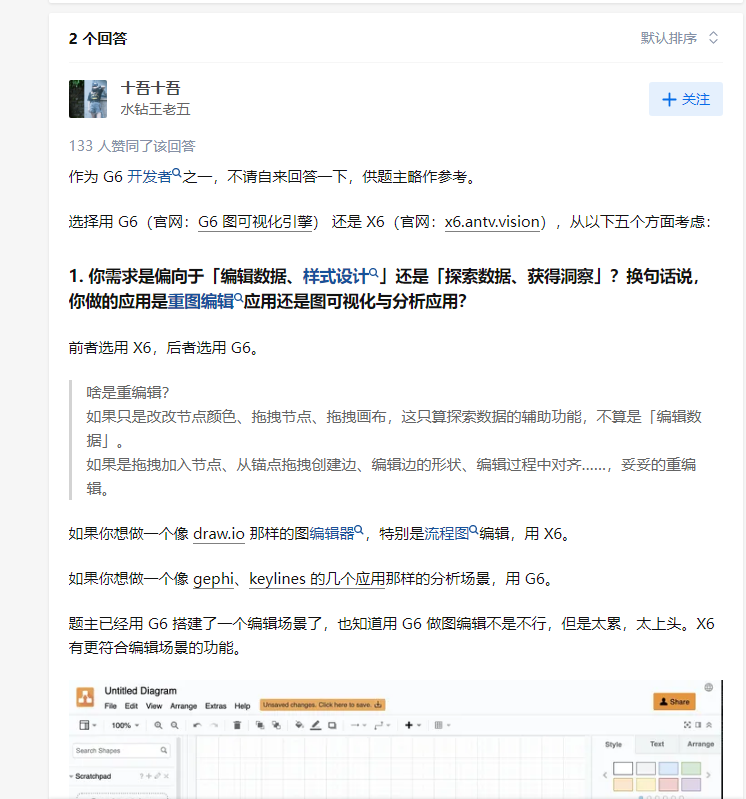
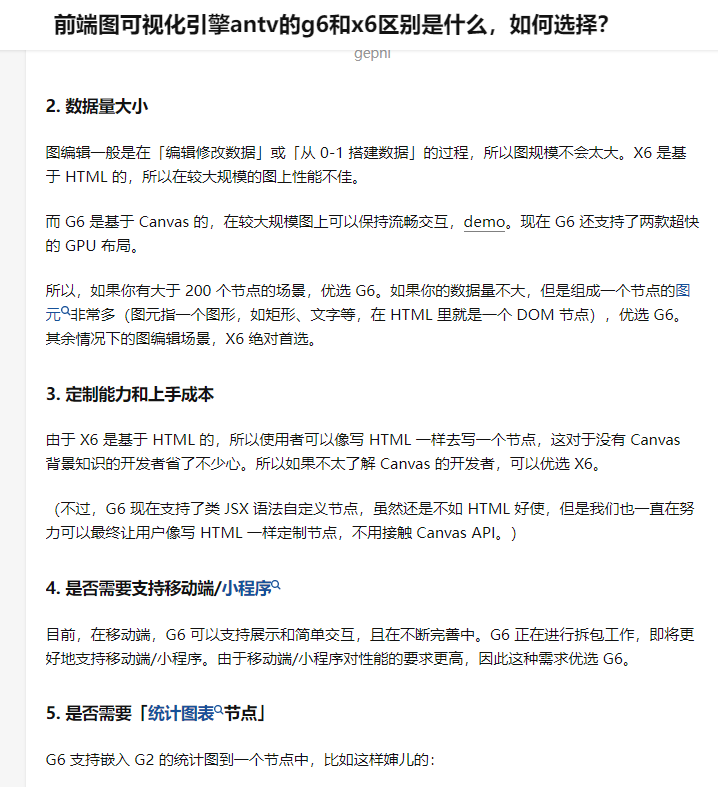
2.2AntV-G6&&AntV-X6
官网地址:
官网地址:
这里为什么写了两个?如果你看过这两个东西,你会发现,他们是在实现一个东西,只不过使用的技术不太一样,一个是canvas,一个是svg。
这里如果想更多的了解他两的区别,不妨去看看参与研发的人员的自述吧:https://www.zhihu.com/question/435855401,如果链接过期了,不妨看看下面的图片吧!
好啦好啦,正题开始吧!
3.实现
3.1阅读官网
首先你需要花费半天或者一天的时间,好好去官网去阅读一下,这个东西应该怎么用,不然你怎能去实现你的功能。
3.2官网的第一个简单的例子
import G6 from "@antv/g6";

const data = {
  nodes: [
    {
      id: "node1",
      label: "Circle1",
      x: 150,
      y: 150
    },
    {
      id: "node2",
      label: "Circle2",
      x: 400,
      y: 150
    }
  ],
  edges: [
    {
      source: "node1",
      target: "node2"
    }
  ]
};

const graph = new G6.Graph({
  container: "container",
  width: 500,
  height: 500,
  defaultNode: {
    type: "circle",
    size: [100],
    color: "#5B8FF9",
    style: {
      fill: "#9EC9FF",
      lineWidth: 3
    },
    labelCfg: {
      style: {
        fill: "#fff",
        fontSize: 20
      }
    }
  },
  defaultEdge: {
    style: {
      stroke: "#e2e2e2"
    }
  }
});

graph.data(data);
graph.render();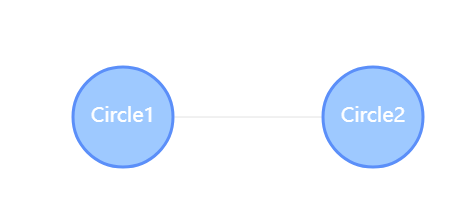
3.3如何安装
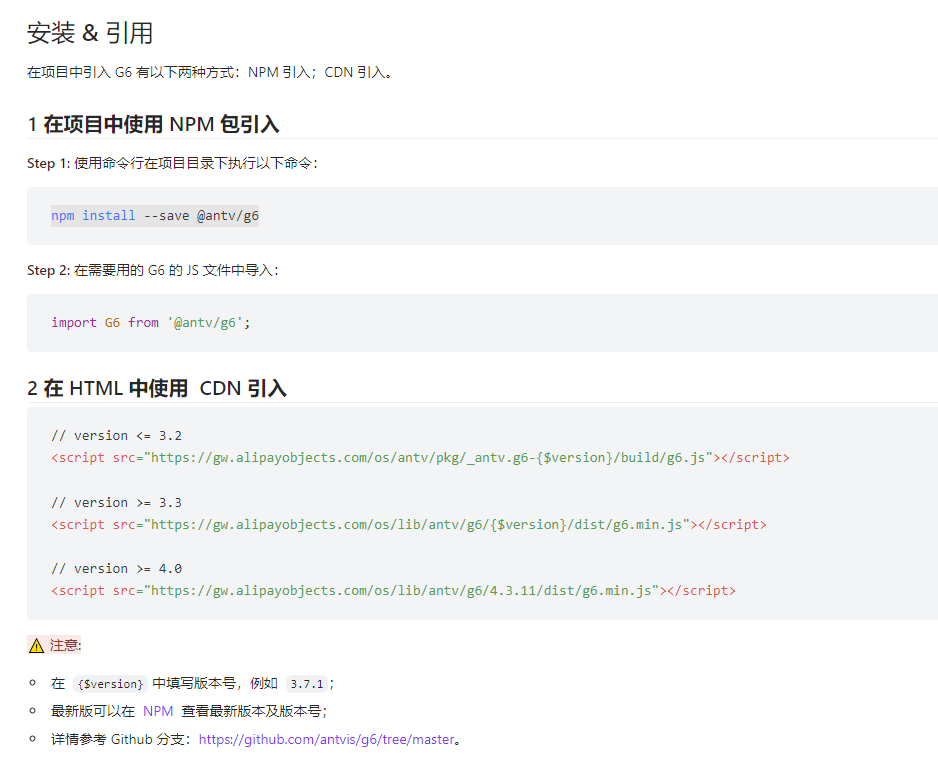
npm install --save @antv/g6
3.4拆件
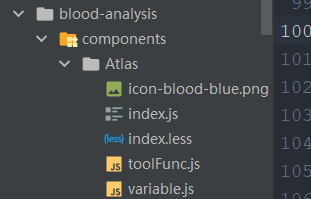
Atlas-->index.js
import React, { useEffect, useRef, useState } from 'react';
import G6, { Graph, } from '@antv/g6';
import { Checkbox, Input, message, Space, Spin } from 'antd';
import IconBlood from './icon-blood-blue.png';
import { MinusOutlined, PlusOutlined } from '@ant-design/icons';
import BigNumber from 'bignumber.js';
import { legendData, options } from './variable';
import { fittingString, getNodeConfig } from './toolFunc';
import './index.less';
import PropTypes from 'prop-types';
import { fetchApi } from 'utils';
import { api } from '../../config';

const pixClassName = 'atlas';
let graph = '';
const MIN_ZOOM = 0.1;
const MAX_ZOOM = 10;
let primaryKey = '';
const Atlas = (props) => {
	const { edges, nodes, selectedNodeId, setTitle, dataType, selectedPrimaryKey } = props;
	const atlas = useRef(null);
	const containerRef = useRef(null);
	const graphRef = useRef(null);
	// 当前选中复选框值
	const [check, setCheck] = useState(['01', '02']);
	const [zoom, setZoom] = useState(0);
	// 选中的节点id
	const [bloodId, setBloodId] = useState(selectedNodeId);
	const [loading, setLoading] = useState(false);
	// 选中的节点类型
	const [checkType, setCheckType] = useState(dataType);
	const nodeBasicMethod = {
		createNodeBox: (group, config, w, h, info) => {
			const { id, dataType } = info;
			/* 最外面的大矩形 */
			const container = group.addShape('rect', {
				attrs: {
					x: 0,
					y: 0,
					width: w,
					height: h,
					fill: bloodId === id ? config.basicColor : '#fff',
					opacity: bloodId === id ? 0.15 : 0,
					cursor: 'pointer',
				},
				name: 'big-rect-shape',
			});
			// 矩形
			group.addShape('rect', {
				attrs: {
					x: 0,
					y: 0,
					width: w,
					height: h,
					stroke: '#D9D9D9',
					radius: 2,
					cursor: 'pointer',
					lineDash: dataType !== 'effectNone' ? undefined : [4, 4]
				},
				name: 'rect-shape',
			});
			// 左边的粗线
			if (dataType !== 'effectNone') {
				group.addShape('rect', {
					attrs: {
						x: 0,
						y: 0,
						width: 3,
						height: h,
						fill: config.basicColor,
						radius: 2,
						cursor: 'pointer',
					},
					name: 'left-border-shape',
				});
			}
			return container;
		},
	};
	G6.registerNode('card-node', {
		draw: (cfg, group) => {
			const config = getNodeConfig(cfg);
			// 中间文字
			group.addShape('text', {
				attrs: {
					text: fittingString(cfg.label, 160, 10),
					x: 10,
					y: 16,
					fontSize: 10,
					fontWeight: 500,
					textAlign: 'left',
					textBaseline: 'middle',
					fill: config.fontColor,
					cursor: 'pointer',
				},
				name: 'name-text-shape',
			});
			// 判断是否为非数据源节点
			if (cfg.dataType !== 'source' && cfg.dataType !== 'effectNone') {
				group.addShape('image', {
					attrs: {
						x: 170,
						y: 7,
						height: 16,
						width: 16,
						img: IconBlood,
						cursor: 'pointer',
						opacity: 0,
					},
					name: 'icon-blood',
				});
			}
			return nodeBasicMethod.createNodeBox(group, config, 190, 30, cfg);
		},
		afterDraw: (cfg, group) => {
			// 获取图标节点
			const iconBox = group.find((element) => element.get('name') === 'big-rect-shape');
			const iconBlood = group.find((element) => element.get('name') === 'icon-blood');
			if (iconBlood && iconBox) {
				const iconBlood = group.find((element) => element.get('name') === 'icon-blood');
				iconBox.on('mouseenter', () => {
					iconBlood.attr('opacity', 1);
				});
				iconBox.on('mouseleave', () => {
					iconBlood.attr('opacity', 0);
				});
			}
		},
		getAnchorPoints: function getAnchorPoints() {
			return [
				[0, 0.5],
				[1, 0.5],
			];
		},
	});
	G6.registerEdge('dashed-line', {
		draw(cfg, group) {
			const startPoint = cfg.startPoint;
			const endPoint = cfg.endPoint;
			const { lineType } = cfg;
			const shape = group.addShape('path', {
				attrs: {
					path: [
						['M', startPoint.x, startPoint.y],
						['L', endPoint.x / 3 + (2 / 3) * startPoint.x, startPoint.y], // 控制点1
						['L', endPoint.x / 3 + (2 / 3) * startPoint.x, endPoint.y],   // 控制点2
						['L', endPoint.x, endPoint.y],
					],
					smooth: true, // 使用平滑的曲线
					stroke: '#999',
					lineWidth: 1,
					endArrow: true,
					lineDash: lineType === 'dashed-line' ? [4, 4] : undefined,
					style: { radius: 10 },
					name: `path-shape-${lineType}`,
				},
			});

			return shape;
		},
	});
	useEffect(() => {
		primaryKey = String(selectedPrimaryKey);
	}, []);
	useEffect(() => {
		const { clientWidth, clientHeight } = atlas.current;
		if (graphRef.current || !containerRef.current) return;
		const legend = new G6.Legend({
			data: legendData,
			align: 'center',
			layout: 'horizontal', // vertical
			position: 'bottom',
			horiSep: 20,
			containerStyle: {
				fill: '#fff',
				opacity: 0,
			}
		});
		graph = new Graph({
			container: containerRef.current,
			width: clientWidth,
			height: clientHeight - 30,
			fitCenter: true,
			defaultNode: {
				type: 'card-node',
			},
			defaultEdge: {
				type: 'dashed-line',
			},
			modes: {
				default: [
					'drag-canvas',
					{
						type: 'zoom-canvas',
						minZoom: MIN_ZOOM,
						maxZoom: MAX_ZOOM
					},
					'click-select',
					{
						type: 'tooltip',
						formatText(model) {
							const { label } = model;
							return label;
						},
						offset: 0,
					}
				]
			},
			plugins: [legend],
			layout: {
				type: 'dagre',
				direction: 'LR',
				rankdir: 'LR',
				nodesep: 50,
				ranksep: 80,
			},
		});

		// 绑定数据
		graph.data({
			edges,
			nodes
		});
		// 渲染图
		graph.render();
		graph.zoomTo(1);
		graphRef.current = graph;
		setZoom(graph.getZoom());
		graph.on('node:click', (evt) => {
			const { item: { _cfg: { model } } } = evt;
			if (model.dataType === 'source') {
				message.info('数据源不支持点击查看');
				return false;
			}
			if (model.dataType === 'effectNone') {
				message.info('无影响');
				return false;
			}
			if (primaryKey === String(model.primaryKey)) {
				message.info('已经处于该节点上,请勿重复点击');
				return false;
			}
			if (model.dataType !== 'source' && primaryKey !== String(model.primaryKey)) {
				setCheck(['01', '02']);
				primaryKey = String(model.primaryKey);
				setCheckType(model.dataType);
				getBloodData('node', model.primaryKey, model.dataType, true, true, model?.additionalData);
			}
		});
		graph.on('wheelzoom', e => {
			let newZoom = graph.getZoom();
			if (newZoom >= MAX_ZOOM) {
				message.info('最大放大10倍');
				newZoom = 10;
			} else if (newZoom <= MIN_ZOOM) {
				message.info('最小缩小10倍');
				newZoom = 0.1;
			}
			setZoom(newZoom);
		});
	}, []);
	const handleChange = (checkedValues) => {
		setCheck(checkedValues);
		const bloodAnalysis = checkedValues.indexOf('01') >= 0;
		const effectAnalysis = checkedValues.indexOf('02') >= 0;
		getBloodData('checkBox', primaryKey, checkType, bloodAnalysis, effectAnalysis);
	};
	const handleZoom = (type) => {
		let newZoom = zoom;
		if (type === 'add') {
			if (zoom >= MAX_ZOOM) {
				newZoom = MAX_ZOOM;
				message.info('最大放大10倍');
			} else if (zoom >= 1) {
				newZoom = Math.min(MAX_ZOOM, Math.floor(newZoom + 1));
			} else {
				newZoom = parseFloat((newZoom + 0.1).toFixed(1));
			}
		} else if (type === 'reduce') {
			if (zoom <= MIN_ZOOM) {
				newZoom = MIN_ZOOM;
				message.info('最小缩小10倍');
			} else if (zoom <= 1) {
				newZoom = Math.max(MIN_ZOOM, parseFloat((newZoom - 0.1).toFixed(1)));
			} else {
				newZoom = Math.max(1, Math.floor(newZoom - 1));
			}
		}
		setZoom(newZoom);
		graph.zoomTo(newZoom, { x: 100, y: 100 }, true);
	};
	const reduceIcon = () => {
		return (
			<MinusOutlined
				style={{
					cursor: 'pointer'
				}}
				onClick={() => {
					handleZoom('reduce');
				}}
			/>
		);
	};
	const addIcon = () => {
		return (
			<PlusOutlined
				style={{
					cursor: 'pointer'
				}}
				onClick={() => {
					handleZoom('add');
				}}
			/>
		);
	};
	const zoomForHundred = () => {
		return new BigNumber(zoom).multipliedBy(100).toFixed(0);
	};
	/**
	 * @description: 获取血缘分析数据
	 * @method: getBloodData
	 * @param: clickType: 点击类型。复选框:checkBox; 节点:node;
	 * @param: dataType: 节点类型。见propTypes中的dataType类型
	 * @param: bloodAnalysis: 血缘分析。true或者false
	 * @param: effectAnalysis: 影响分析。true或者false
	 * @param: additionalData: 附加信息。从后台数据中的节点获取对应字段内容
	 * @author: 上官靖宇
	 * @date: 2023/8/21
	 * @lastEditors: 上官靖宇
	 */
	const getBloodData = (clickType, primaryKey, dataType, bloodAnalysis, effectAnalysis, additionalData = null) => {
		setLoading(true);
		graph.clear();
		fetchApi({
			api: api.bloodDataList,
			data: {
				dataType: dataType,
				primaryKey: primaryKey,
				consanguinityAnalysis: bloodAnalysis,
				effectAnalysis,
				additionalData,
			},
			complete: () => {
				setLoading(false);
			},
			success: (res) => {
				const { title, edges, nodes } = res;
				setTitle(title);
				setBloodId(res.selectedNodeId);
				graph.data({
					edges,
					nodes
				});
				graph.render();
				graph.zoomTo(1);
				setZoom(1);
			},
			error: (err) => {
				setTitle('');
				const { errorDescription } = err;
				message.error(errorDescription || '请求失败');
			}
		});
	};
	return (
		<div className={pixClassName} ref={atlas}>
			{/*操作栏*/}
			<div className={`${pixClassName}-ope`}>
				<Space>
					<Checkbox.Group
						value={check}
						options={options}
						onChange={handleChange}
					/>
				</Space>
				<Space>
					<Input
						value={zoomForHundred()}
						style={{
							width: '110px'
						}}
						readOnly
						prefix={reduceIcon()}
						suffix={addIcon()}
					/>
				</Space>
			</div>
			<Spin spinning={loading} tip="数据更新中...">
				<div ref={containerRef} />
			</Spin>
		</div>
	);
};
Atlas.propTypes = {
	// 节点线信息
	edges: PropTypes.array,
	// 节点信息
	nodes: PropTypes.array,
	// 选中节点id,用于设置选中状态
	selectedNodeId: PropTypes.string,
	// 修改导航栏title
	setTitle: PropTypes.func,
	// 节点类型(数据类型: source:数据源; table:数据表; dataSet:数据集; dashboard;数据报表; chart:单图)
	dataType: PropTypes.string,
	// 选中节点primaryKey,用于后天提交参数
	selectedPrimaryKey: PropTypes.string
};
export default Atlas;
toolFunc.js
import {
	basicColorDataReport,
	basicColorDataSet,
	basicColorDataSheet,
	basicColorDataSingle,
	basicColorDataSource,
	fontColor
} from './variable';
import G6 from '@antv/g6';

const getNodeConfig = (node) => {
	// 默认数据源
	let config = {
		basicColor: basicColorDataSource,
		fontColor: fontColor,
		borderColor: basicColorDataSource,
	};
	switch (node.dataType) {
		case 'table': { // 数据表
			config = {
				basicColor: basicColorDataSheet,
				fontColor: fontColor,
				borderColor: basicColorDataSheet,
			};
			break;
		}
		case 'dataSet': { // 数据集
			config = {
				basicColor: basicColorDataSet,
				fontColor: fontColor,
				borderColor: basicColorDataSet,
			};
			break;
		}
		case 'chart': { // 单图
			config = {
				basicColor: basicColorDataSingle,
				fontColor: fontColor,
				borderColor: basicColorDataSingle,
			};
			break;
		}
		case 'dashboard': { // 数据报表
			config = {
				basicColor: basicColorDataReport,
				fontColor: fontColor,
				borderColor: basicColorDataReport,
			};
			break;
		}
		default:
			break;
	}
	return config;
};

/**
 * format the string
 * @param {string} str The origin string
 * @param {number} maxWidth max width
 * @param {number} fontSize font size
 * @return {string} the processed result
 */
const fittingString = (str, maxWidth, fontSize) => {
	const ellipsis = '...';
	const ellipsisLength = G6.Util.getTextSize(ellipsis, fontSize)[0];
	let currentWidth = 0;
	let res = str;
	const pattern = new RegExp('[\u4E00-\u9FA5]+'); // distinguish the Chinese charactors and letters
	str.split('').forEach((letter, i) => {
		if (currentWidth > maxWidth - ellipsisLength) return;
		if (pattern.test(letter)) {
			// Chinese charactors
			currentWidth += fontSize;
		} else {
			// get the width of single letter according to the fontSize
			currentWidth += G6.Util.getLetterWidth(letter, fontSize);
		}
		if (currentWidth > maxWidth - ellipsisLength) {
			res = `${str.substr(0, i)}${ellipsis}`;
		}
	});
	return res;
};

export {
	getNodeConfig,
	fittingString
};
variable.js
// 文字颜色
const fontColor = '#222';
const basicColorDataSource = '#5762EC';
const basicColorDataSheet = '#07A6F0';
const basicColorDataSet = '#39BF7C';
const basicColorDataSingle = '#F9BE0E';
const basicColorDataReport = '#FF892F';
const data = {
	nodes: [
		{
			id: '1',
			label: '园区标准数据集',
			dataType: 'dataSource',
		},
		{
			id: '2',
			label: 'dm_user_activity_launch_daily',
			dataType: 'dataSheet',
		},
		{
			id: '3',
			label: 'dim_user_user',
			dataType: 'dataSheet',
		},
		{
			id: '4',
			label: '用户活跃日表',
			dataType: 'dataSet',
		},
		{
			id: '5',
			label: '用户统计表',
			dataType: 'dataSingle',
		},
		{
			id: '6',
			label: '每日用户活跃统计',
			dataType: 'dataSingle',
		},
		{
			id: '7',
			label: '用户行为分析',
			dataType: 'dataReport',
		},
	],
	edges: [
		{
			source: '1',
			target: '2',
			lineType: 'solid-line'
		},
		{
			source: '1',
			target: '3',
			lineType: 'solid-line'
		},
		{
			source: '2',
			target: '4',
			lineType: 'solid-line'
		},
		{
			source: '3',
			target: '4',
			lineType: 'solid-line'
		},
		{
			source: '4',
			target: '5',
			lineType: 'dashed-line'
		},
		{
			source: '4',
			target: '6',
			lineType: 'dashed-line'
		},
		{
			source: '5',
			target: '7',
			lineType: 'dashed-line'
		},
		{
			source: '6',
			target: '7',
			lineType: 'dashed-line'
		},
	],
};
const legendData = {
	nodes: [{
		id: 'DataSource',
		label: '数据源',
		order: 0,
		style: {
			fill: basicColorDataSource,
		}
	}, {
		id: 'DataSheet',
		label: '数据表',
		order: 2,
		style: {
			fill: basicColorDataSheet,
		}
	}, {
		id: 'DataSet',
		label: '数据集',
		order: 3,
		style: {
			fill: basicColorDataSet,
		}
	}, {
		id: 'DataSingle',
		label: '单图',
		order: 4,
		style: {
			fill: basicColorDataSingle,
		}
	}, {
		id: 'DataReport',
		label: '数据报表',
		order: 5,
		style: {
			fill: basicColorDataReport,
		}
	}]
};
const options = [
	{ label: '血缘分析', value: '01' },
	{ label: '影响分析', value: '02' }
];
export {
	fontColor,
	basicColorDataSource,
	basicColorDataSheet,
	basicColorDataSet,
	basicColorDataSingle,
	basicColorDataReport,
	data,
	legendData,
	options
};
index.less
@charset "UTF-8";
/* @describe:
 * @author: 上官靖宇
 * @date: 2023/8/2 14:49
 */
@import '~styles/ant-prefix.less';
.atlas {
	width: 100%;
	height: 100%;
	box-sizing: border-box;
	overflow: hidden;
	&-ope {
		display: flex;
		justify-content: space-between;
		padding: 0 10px;
		height: 40px;
		line-height: 40px;
		.@{ant-prefix}-input {
			text-align: center;
		}
	}
}

.g6-tooltip {
	border-radius: 6px;
	font-size: 12px;
	color: #fff;
	background-color: #000;
	padding: 2px 8px;
	text-align: center;
}
icon-blood-blue.png只是个图标,大家可以自己随便放一个图片
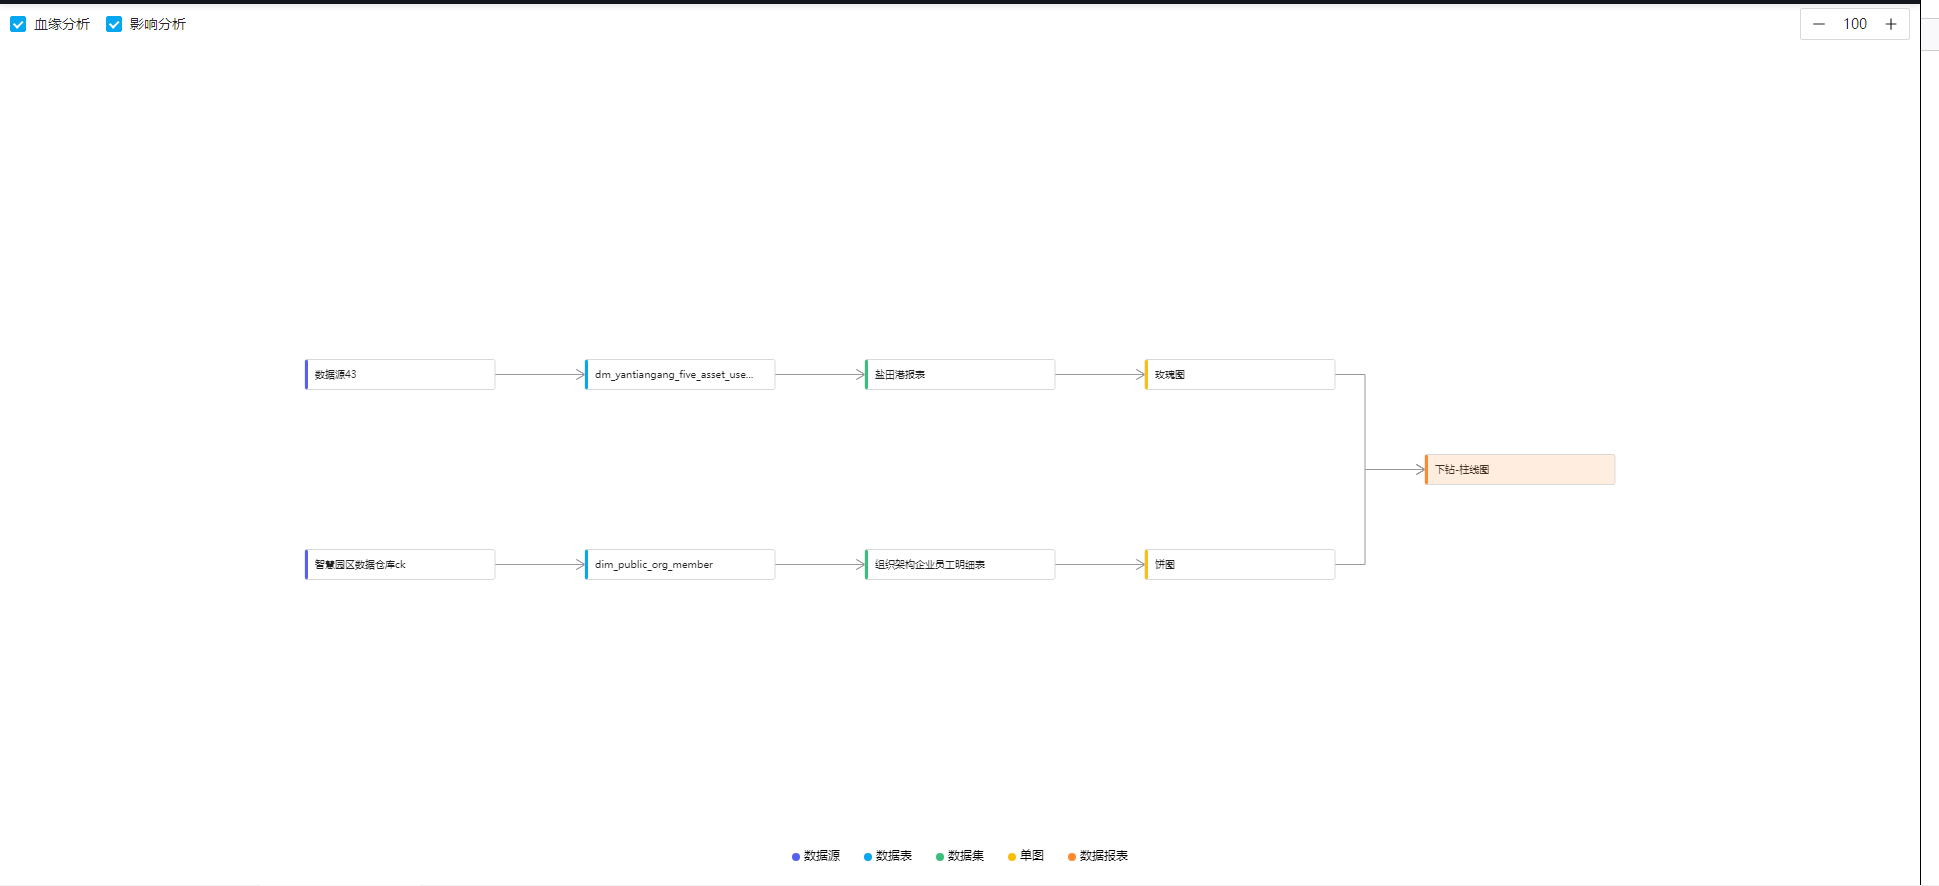
实现如上图所示
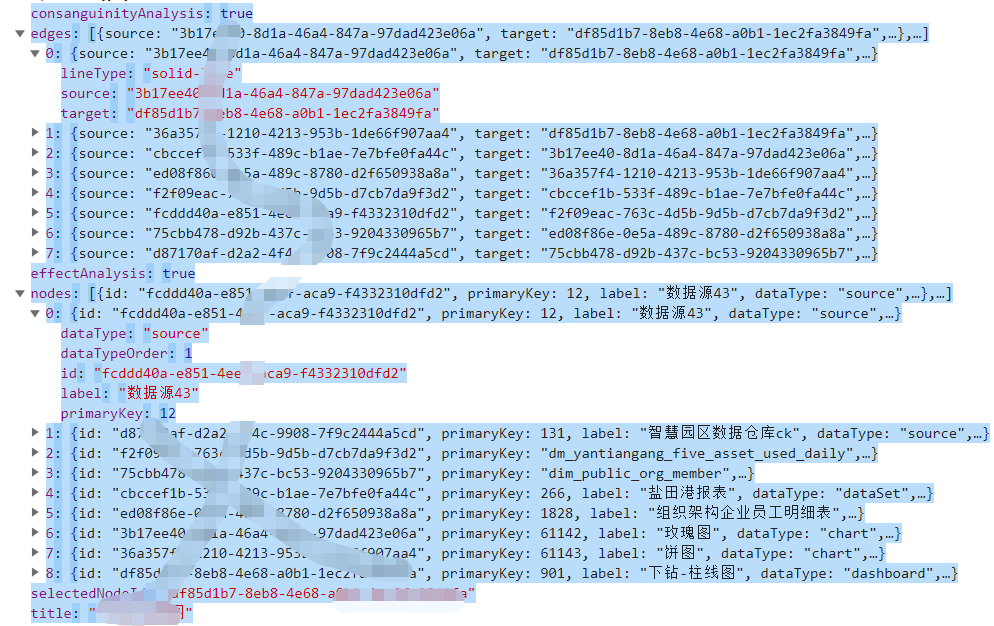
后端数据格式参考


【推荐】国内首个AI IDE,深度理解中文开发场景,立即下载体验Trae
【推荐】编程新体验,更懂你的AI,立即体验豆包MarsCode编程助手
【推荐】抖音旗下AI助手豆包,你的智能百科全书,全免费不限次数
【推荐】轻量又高性能的 SSH 工具 IShell:AI 加持,快人一步
· 基于Microsoft.Extensions.AI核心库实现RAG应用
· Linux系列:如何用heaptrack跟踪.NET程序的非托管内存泄露
· 开发者必知的日志记录最佳实践
· SQL Server 2025 AI相关能力初探
· Linux系列:如何用 C#调用 C方法造成内存泄露
· Manus爆火,是硬核还是营销?
· 终于写完轮子一部分:tcp代理 了,记录一下
· 别再用vector<bool>了!Google高级工程师:这可能是STL最大的设计失误
· 单元测试从入门到精通
· 震惊!C++程序真的从main开始吗?99%的程序员都答错了