python 用 matplotlib 中的 patches 模块绘制圆形步骤详解
版本说明:

0、import
import numpy as np
import matplotlib.pyplot as plt
from matplotlib.patches import Circle
1、绘制圆形
# 创建画布
fig = plt.figure(figsize=(12, 8),
facecolor='beige', # 米黄色
)
# 划分子区
axes = fig.subplots(nrows=2,
ncols=2,
)
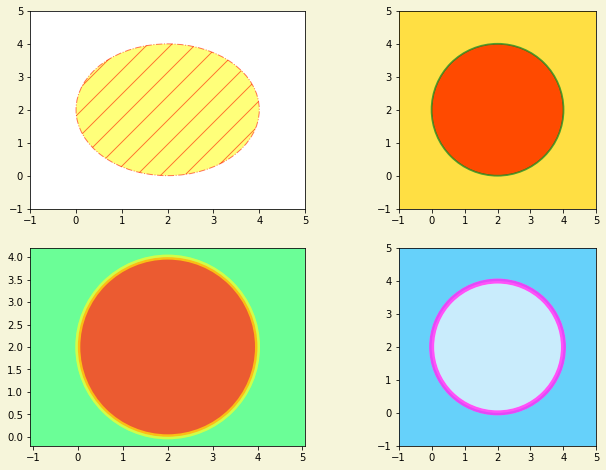
# --------------------------------- subplot(221) ---------------------------------
ax = axes[0, 0]
cicle = Circle(xy=(2, 2), # 圆心坐标
radius=2, # 半径
fc='white', # facecolor
ec='cornflowerblue', # 浅蓝色,矢车菊蓝
)
ax.add_patch(p=cicle)
circle.set(facecolor='yellow',
alpha=0.5,
hatch='/',
ls='-.',
ec='r'
)
# 调整坐标轴刻度范围
ax.set(xlim=(-1, 5),
ylim=(-1, 5)
)
# --------------------------------- subplot(222) ---------------------------------
ax = axes[0, 1]
rectangle = ax.patch
rectangle.set(facecolor='gold',
alpha=0.7
)
circle = Circle(xy=(2, 2), # 圆心
radius=2, # 半径
)
ax.add_patch(p=circle)
circle.set(fc='red', # facecolor
ec='green', # edgecolor,
alpha=0.6,
lw=2, # line widht
)
# 调整坐标轴
ax.set(xlim=(-1, 5),
ylim=(-1, 5),
aspect='equal' # x 轴和 y 轴的刻度单位比率
)
# --------------------------------- subplot(223) ---------------------------------
ax = axes[1, 0]
rectangle = ax.patch
rectangle.set(facecolor='palegreen', # 淡绿色,苍绿色
alpha=1
)
circle = Circle(xy=(2, 2), # 圆心
radius=2, # 半径
)
ax.add_patch(p=circle)
circle.set(fc='red', # facecolor
ec='yellow', # edgecolor,
alpha=0.6,
lw=5, # line widht
)
# 调整坐标轴
ax.axis('equal' # x 轴和 y 轴的刻度单位比率
)
# --------------------------------- subplot(224) ---------------------------------
ax = axes[1, 1]
rectangle = ax.patch
rectangle.set(facecolor='lightskyblue',
alpha=1
)
circle = Circle(xy=(2, 2), # 圆心
radius=2, # 半径
)
ax.add_patch(p=circle)
circle.set(fc='white', # facecolor
ec='magenta', # edgecolor, 品红
alpha=0.6,
lw=5, # line widht
)
# 调整坐标轴
ax.axis([-1, 5, 1, 5]) # 坐标轴刻度范围 [xmin, xmax, ymin, ymax]
ax.set(aspect='equal', # x 轴和 y 轴的刻度单位比率
yticks=range(-1, 6, 1) # 刻度位置
)
# 设置子区布局
plt.subplots_adjust(left=0.1,
right=0.8
)
# 显示图形
plt.show()
图形:
非学无以广才,非志无以成学。

 浙公网安备 33010602011771号