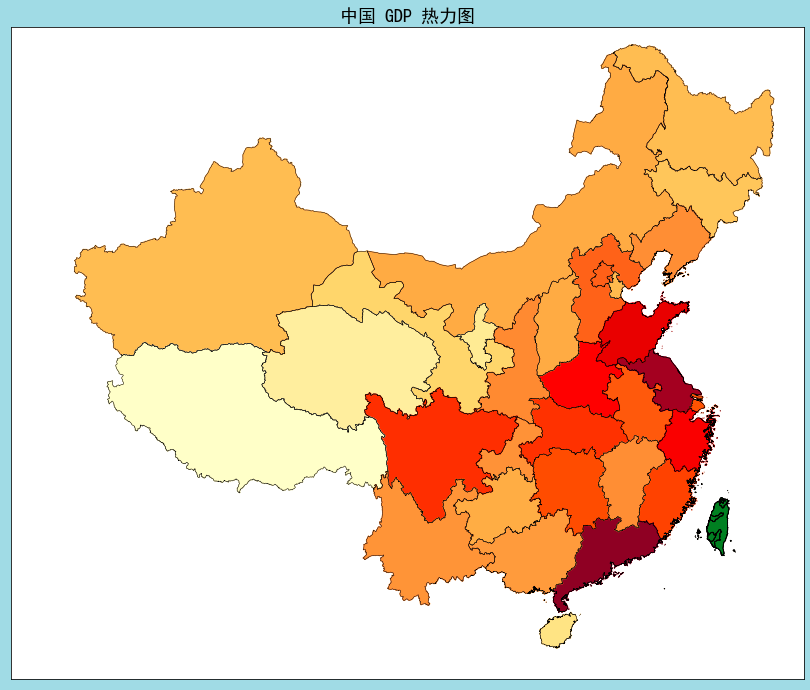
python 用 basemap 绘制中国 19 年 GDP 热力地图
0、import
import pandas as pd
import matplotlib as mpl
import matplotlib.pyplot as plt
from matplotlib.colors import rgb2hex
from matplotlib.patches import Polygon
from mpl_toolkits.basemap import Basemap
1、绘图
# 数据准备
df = pd.read_csv('E:/pyspace/dataset/CHN_GDP(00-19).csv',
                 skiprows=3,
                 skipfooter=3,
                 encoding='utf-8',
                 engine='python'
                )

districts, gdp = zip(*df[['地区', '2019年']].values)
d =  [district[:3] if set(district).intersection('龙内')
      else district[:2] for district in df['地区']]
GDP = pd.Series( gdp,
                  index=d
                 )

# 根据 GDP 为每个省级行政区配置不同的填充颜色
cmap = plt.cm.YlOrRd
colors = {s:cmap(np.sqrt((GDP[s] - GDP.min()) / (GDP.max() - GDP.min())))[:3]
          for s in GDP.index}


# 使图表正常显示中文
mpl.rcParams['font.sans-serif'] = 'SimHei'
# 使坐标轴刻度标签正常显示负号
mpl.rcParams['axes.unicode_minus'] = False

plt.figure(figsize=(16, 12),
           facecolor='lightblue'
          )


m =Basemap(llcrnrlon=77,llcrnrlat=14,
            urcrnrlon=140,urcrnrlat=51,
            projection='lcc',
            lat_1=33,lat_2=45,lon_0=100)
# 国界线
# m.drawcountries(linewidth=1.5)
# m.drawcoastlines()

# 读取省份边界数据
m.readshapefile('gadm36_CHN_shp/gadm36_CHN_1',
                'states',
                drawbounds=True)


# 建立一个与 GDP 颜色 有关联的各省地图名称列表
states = []
provinces = m.states_info #读取省份信息
for p in m.states_info:
    p_name = p['NL_NAME_1'].split('|')
    if len(p_name) > 1:
        s = p_name[1][:2]
        if s == '内蒙':
            s = '内蒙古'
        if s == '黑龍':
            s = '黑龙江'
    else:
        s = p_name[0]
    states.append(s)

ax = plt.gca()
for nshape, seg in enumerate(m.states):
    color = rgb2hex(colors[states[nshape]]) # 将 RGB 色彩转为 HEX 色彩
    # 将每个省份对应的颜色进行填充
    poly = Polygon(seg,
                   facecolor=color,
                   edgecolor=color)
    ax.add_patch(poly)

# 读取台湾边界数据
m.readshapefile('gadm36_TWN_shp/gadm36_TWN_1',
                'taiwan',
                drawbounds=True)
for seg in m.taiwan:
    poly = Polygon(seg,
                    facecolor='green',
                    edgecolor='k') #将每个省份对应的颜色进行填充
    ax.add_patch(poly)

ax.set_title(label='中国 GDP 热力图',
             fontdict={'fontsize':18}
            )

# 显示地图
plt.show()
地图:

说明:
1、GDP 数据可参看 https://www.cnblogs.com/shanger/p/13153014.html
2、需要下载 shepefile 文件
3、台湾的 GDP 数据没有去查,直接填充了绿色。
非学无以广才,非志无以成学。


 浙公网安备 33010602011771号