python 移动坐标轴到图中央
1、简单绘制 sin(x)
import mglearn
import matplotlib.pyplot as plt

mglearn.plots.plot_knn_regression(n_neighbors=2)

plt.show()
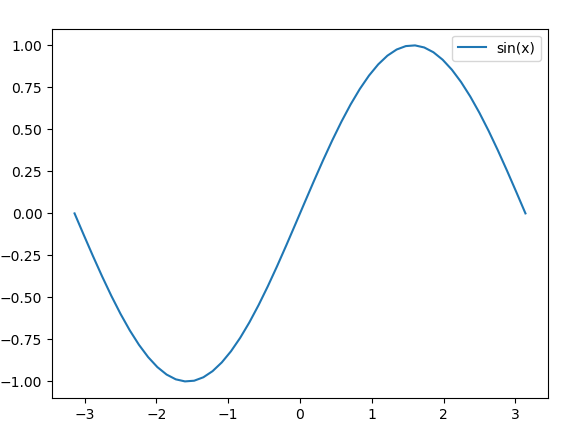
2、隐藏上边和右边的两条轴线
import numpy as np
import matplotlib.pyplot as plt

x = np.linspace(-np.pi , np.pi)
y = np.sin(x)

plt.plot(x, y)

ax = plt.gca()
ax.spines['right'].set_color('none')
ax.spines['top'].set_color('none')


plt.legend(['sin(x)'])

plt.show()

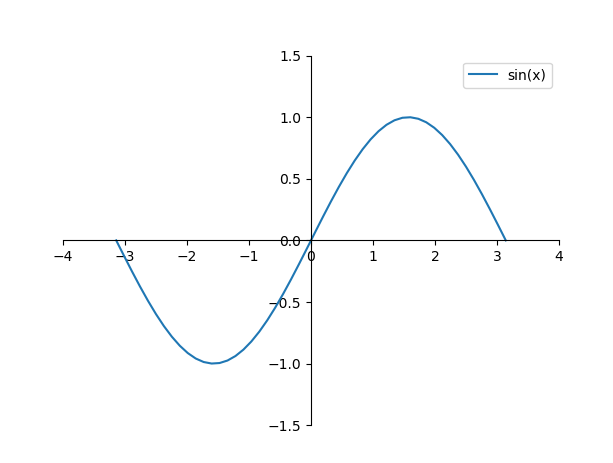
3、将坐标轴移至中心
import numpy as np
import matplotlib.pyplot as plt

x = np.linspace(-np.pi , np.pi)
y = np.sin(x)

plt.plot(x, y)

ax = plt.gca()
ax.spines['right'].set_color('none')
ax.spines['top'].set_color('none')
ax.spines['left'].set_position(('data', 0))
ax.spines['bottom'].set_position(('data', 0))

plt.xlim(-4, 4)
plt.ylim(-1.5, 1.5)

plt.legend(['sin(x)'])

plt.show()
。。。
非学无以广才,非志无以成学。

 浙公网安备 33010602011771号