
Python 和 R语言 中的折线图
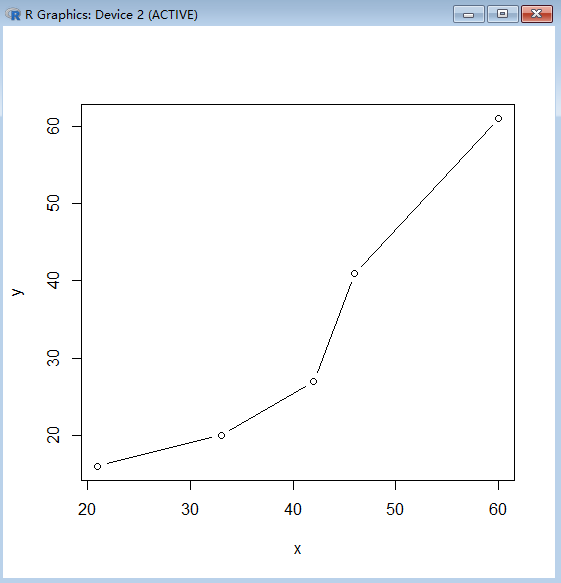
1、用 R 的基础图形系统
 x <- c(21, 33, 42, 46, 60)
 y <- c(16, 20, 27, 41, 61)

plot(x, y, type='b')
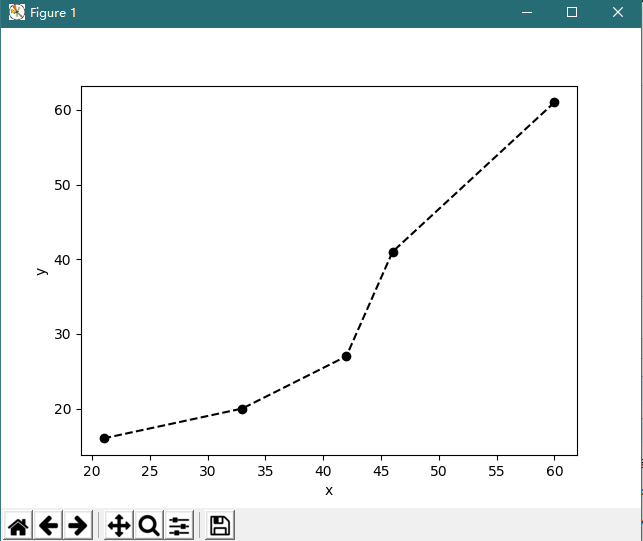
2 matplotlib 库
import matplotlib.pyplot as plt

x = [21, 33, 42, 46, 60]
y = [16, 20, 27, 41, 61]

plt.plot(x, y, marker='o', ls='--', c='k')
plt.xlabel('x')
plt.ylabel('y')

plt.show()
按语:
R 可以自动给出坐标轴标题。
非学无以广才,非志无以成学。

