LPC43XX JTAG Scan Chain
Debug and trace functions are integrated into the ARM Cortex-M4.
Serial wire debug and trace functions are supported in addition to a standard JTAG debug and parallel trace functions.
The ARM Cortex-M4 is configured to support up to eight breakpoints and four watch points.
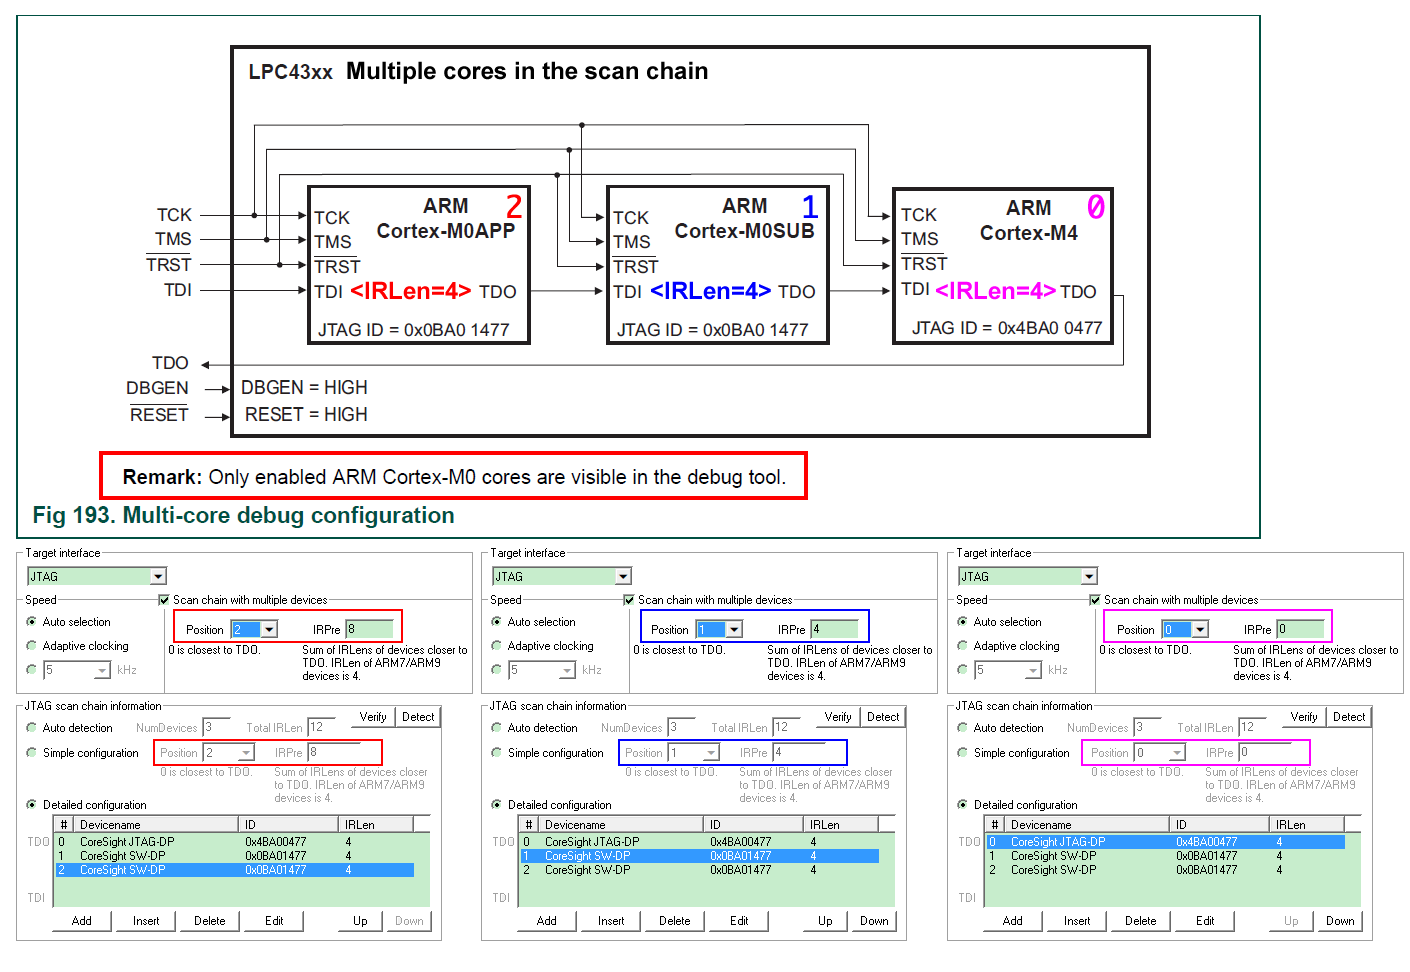
The ARM Cortex-M0 coprocessor supports JTAG debug.
A standard ARM Cortex-compliant debugger can debug the ARM Cortex-M4 and the ARM Cortex-M0 cores separately or both cores simultaneously.
Remark:
In order to debug the ARM Cortex-M0, release the M0 reset by software in the RGU block.

 浙公网安备 33010602011771号