【笔记】Python3|使用 PyVis 完成神经网络数据集的可视化
文章目录
版本:
pyvis 0.2.1
应用实例:
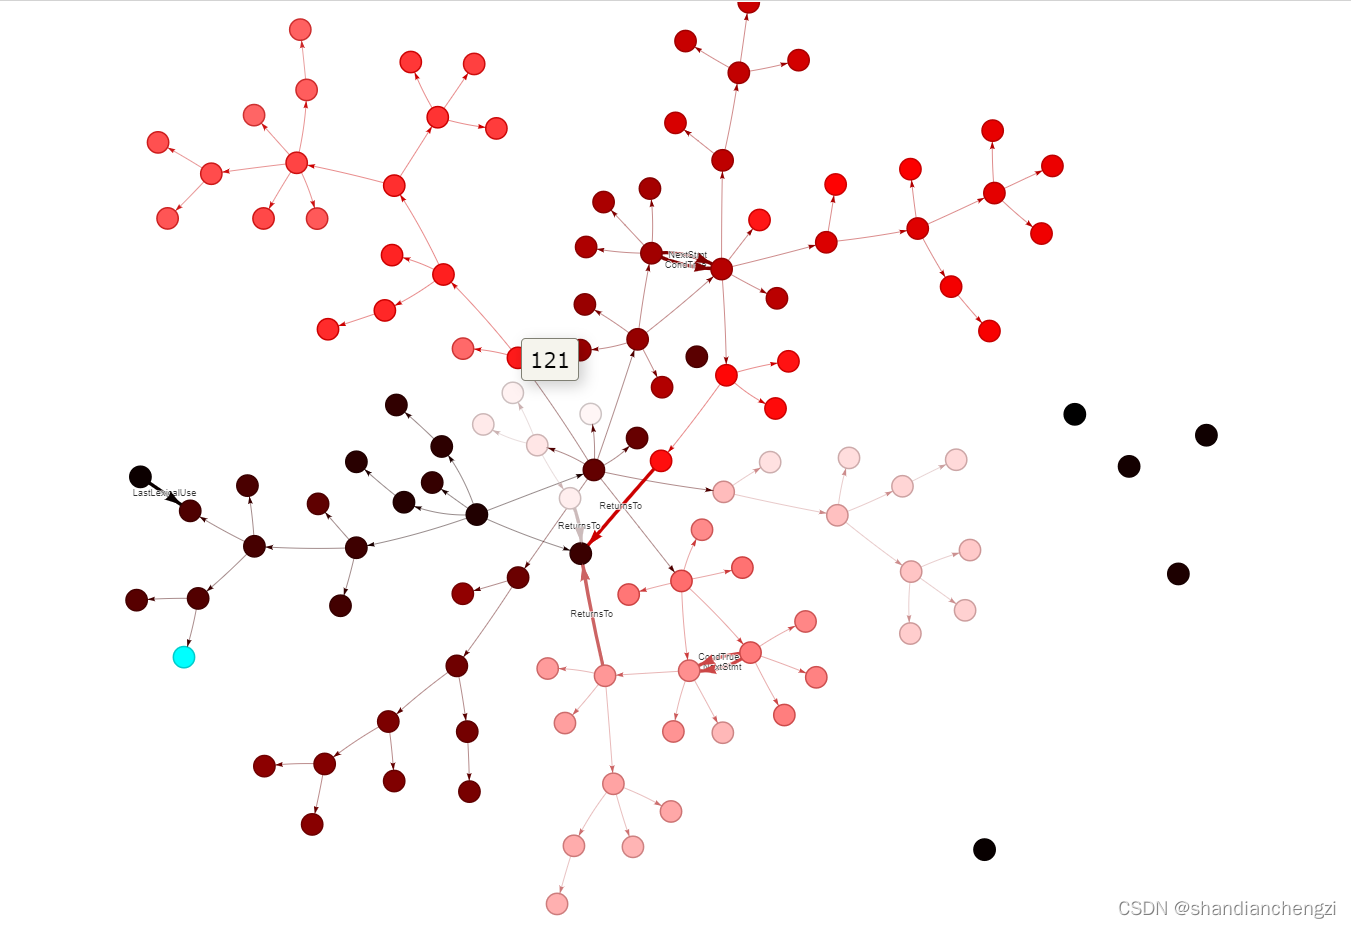
1 神经网络可视化
我自己的仓库:https://github.com/shandianchengzi/tree_sitter_DataExtractor。根目录的test1.html就是测试结果,show_data.py是本篇博客主要涉及的代码。
可视化结果:
2 别人的示例和代码
自定义 Pyvis 交互式网络图。有文字有图片有代码,讲得不错。
PyVis的应用:
零、官方教程
https://pyvis.readthedocs.io/en/latest/tutorial.html。
一、初始化画布Network
默认设置的初始化方式(长宽500px、无向图):
>>> from pyvis.network import Network
>>> net = Network()
其中Network()里可以加自定义参数,如长宽1000px、有向图:
net = Network('1000px', '1000px', directed=True)
可以修改的参数有:
| 参数名 | 默认值 | 说明 |
|---|---|---|
| height | 500px | 画布高度 |
| width | 500px | 画布宽度 |
| directed | False | 是否是有向图 |
| notebook | False | True if using jupyter notebook. |
| bgcolor | #ffffff | 画布背景颜色 |
| font_color | False | The color of the node labels text |
| layout | None | Use hierarchical layout if this is set |
授人以鱼不如授人以渔,这些参数、默认值以及说明全部都可以直接在pyvis的源代码中看到:https://github.com/WestHealth/pyvis/blob/master/pyvis/network.py。
二、添加结点
添加单个结点add_node:
>>> net.add_node(1, label="Node 1") # node id = 1 and label = Node 1
>>> net.add_node(2) # node id and label = 2
支持的参数:
n_id: 唯一标识(str or int)
label: 结点标签。
以上必须,以下可选。
· borderWidth: The width of the border of the node.
· borderWidthSelected: The width of the border of the node when it is selected. When undefined, the borderWidth * 2 is used.
· brokenImage: 图片结点(shape=image或circularImage)加载不出来时,显示的URL或文字说明。
· group: 如果未定义,则节点将属于已经定义的组。该组的样式信息将应用于此节点。特定于节点的样式会覆盖组样式。
· hidden: When true, the node will not be shown. It will still be part of the physics simulation though!
· image: When the shape is set to image or circularImage, this option should be the URL to an image. If the image cannot be found, the brokenImage option can be used.
· labelHighlightBold: Determines whether or not the label becomes bold when the node is selected.
· level: When using the hierarchical layout, the level determines where the node is going to be positioned.
· mass: The barnesHut physics model (which is enabled by default) is based on an inverted gravity model. By increasing the mass of a node, you increase it's repulsion. Values lower than 1 are not recommended.
· physics: When false, the node is not part of the physics simulation. It will not move except for from manual dragging.
· shape: 定义了节点的外观。节点有两种类型。一种是标签在内部,另一种是标签在下方。标签在内部的类型有:椭圆ellipse、圆形circle、数据库database、方框box、文本text 。标签在外面的类型有:图像image、圆形图像circularImage、菱形diamond、点dot、星形star、三角形triangle、下三角triangleDown、正方形square和图标icon。
· size: The size is used to determine the size of node shapes that do not have the label inside of them. These shapes are: image, circularImage, diamond, dot, star, triangle, triangleDown, square and icon.
· title: 鼠标移到结点上方时,会显示的内容。hover-text。
· value: When a value is set, the nodes will be scaled using the options in the scaling object defined above.
· x: This gives a node an initial x position. When using the hierarchical layout, either the x or y position is set by the layout engine depending on the type of view. The other value remains untouched. When using stabilization, the stabilized position may be different from the initial one. To lock the node to that position use the physics or fixed options.
· y: This gives a node an initial y position. When using the hierarchical layout,either the x or y position is set by the layout engine depending on the type of view. The other value remains untouched. When using stabilization, the stabilized position may be different from the initial one. To lock the node to that position use the physics or fixed options.
更详细的参数赋值说明直接看源代码:https://github.com/WestHealth/pyvis/blob/58a3b673832670240c8f025d9e76168370214c84/pyvis/network.py#L128。
添加一系列结点add_nodes:
可选参数变少了,只支持参数["size", "value", "title", "x", "y", "label", "color", "shape"]。
应用样例如下:
net.add_nodes(range(node_nums),
                 title=[str(x) for x in range(node_nums)],
                 label=[name[str(x)] for x in range(node_nums)],
                 color=color
                 )
三、添加边
添加一条边add_edge:
>>> net.add_node(0, label='a')
>>> net.add_node(1, label='b')
>>> net.add_edge(0, 1)
支持的参数:
· arrowStrikethrough: When false, the edge stops at the arrow. This can be useful if you have thick lines and you want the arrow to end in a point. Middle arrows are not affected by this.
· from: Edges are between two nodes, one to and one from. This is where you define the from node. You have to supply the corresponding node ID. This naturally only applies to individual edges.
· hidden: When true, the edge is not drawn. It is part still part of the physics simulation however!
· physics: When true, the edge is part of the physics simulation. When false, it will not act as a spring.
· title: The title is shown in a pop-up when the mouse moves over the edge.
· to: Edges are between two nodes, one to and one from. This is where you define the to node. You have to supply the corresponding node ID. This naturally only applies to individual edges.
· value: When a value is set, the edges' width will be scaled using the options in the scaling object defined above.
· width: The width of the edge. If value is set, this is not used.
添加多条边add_edges:
>>> edges = [[0,1],[1,2,2],[2,3]]
>>> net.add_edges(edges)
只支持width参数,它的实现是这样的,相当鸡肋,感觉可能是作者懒得写了:
def add_edges(self, edges):
    for edge in edges:
        # if incoming tuple contains a weight
        if len(edge) == 3:
            self.add_edge(edge[0], edge[1], width=edge[2])
        else:
            self.add_edge(edge[0], edge[1])
四、为结点添加漂亮的颜色(从而表明结点顺序)
color = ['#00ffff']  # 为第一个结点赋予特殊颜色
for x in range(node_nums - 1):
    current_of_color = int(x / node_nums * 255 * 2)
    if current_of_color > 255:
        color.append('#%02x%02x%02x' % (255, current_of_color - 255, current_of_color - 255))
    else:
        color.append('#%02x%02x%02x' % (current_of_color, 0, 0))
参考:《如何实现从一种颜色的渐变效果(如从深红-红-浅红),RGB()不好用,但又没有SHL()这个函数。》-CSDN-帖子
完整代码(仅供参考):
from pyvis.network import Network
import gzip
import json

def load_graph(path):
    with gzip.open(path, 'r') as f:
        content = f.read().decode('utf-8')
        context_graph = []
        items = content.split('\n')
        for item in items:
            try:
                context_graph.append(json.loads(item))
            except:
                print(item)
        return context_graph

# input:path:数据集路径;index:数据集条目索引;labels:需要显示的额外边的名称
# 将数据集的某条数据可视化
def show_graph(path, index, *labels):
    # 1. 载入数据
    graph = load_graph(path)
    one_data = graph[index]
    child_edges = one_data['ContextGraph']['Edges']['Child']
    node_nums = len(one_data['ContextGraph']['NodeLabels'])
    # 2. 为结点按顺序选取不同的颜色(从深色冷色调到浅色暖色调,并为首个结点赋予特殊颜色,这种方法在结点超过255*2后相邻结点颜色可能重复)
    color = ['#00ffff']  # 为第一个结点赋予特殊颜色
    for x in range(node_nums - 1):
        current_of_color = int(x / node_nums * 255 * 2)
        if current_of_color > 255:
            color.append('#%02x%02x%02x' % (255, current_of_color - 255, current_of_color - 255))
        else:
            color.append('#%02x%02x%02x' % (current_of_color, 0, 0))
    # 3. 初始化画布,并添加结点和Child边
    nt = Network('1000px', '1000px', directed=True)
    nt.add_nodes(range(node_nums),
                 title=[str(x) for x in range(node_nums)],
                 label=[one_data['ContextGraph']['NodeLabels'][str(x)] for x in range(node_nums)],
                 color=color
                 )
    nt.add_edges(child_edges)
    # 4. 依次添加其他需要额外显示的边
    for idx, (label) in enumerate(labels):
        try:
            to_show_edges = one_data['ContextGraph']['Edges'][label]
            for edge in to_show_edges:
                nt.add_edge(edge[0], edge[1],
                            value=4,
                            label=label)
        except:
            print('no ' + label + ' edges')
            return
    # 5. 显示图
    nt.show(path.split('/')[-1].split('.')[0] + str(index) + '.html')
本账号所有文章均为原创,欢迎转载,请注明文章出处:https://blog.csdn.net/qq_46106285/article/details/125638283。百度和各类采集站皆不可信,搜索请谨慎鉴别。技术类文章一般都有时效性,本人习惯不定期对自己的博文进行修正和更新,因此请访问出处以查看本文的最新版本。


【推荐】国内首个AI IDE,深度理解中文开发场景,立即下载体验Trae
【推荐】编程新体验,更懂你的AI,立即体验豆包MarsCode编程助手
【推荐】抖音旗下AI助手豆包,你的智能百科全书,全免费不限次数
【推荐】轻量又高性能的 SSH 工具 IShell:AI 加持,快人一步
· Manus重磅发布:全球首款通用AI代理技术深度解析与实战指南
· 被坑几百块钱后,我竟然真的恢复了删除的微信聊天记录!
· 没有Manus邀请码?试试免邀请码的MGX或者开源的OpenManus吧
· 园子的第一款AI主题卫衣上架——"HELLO! HOW CAN I ASSIST YOU TODAY
· 【自荐】一款简洁、开源的在线白板工具 Drawnix