openlayers6基础使用
基础地图
<!DOCTYPE html>
<html lang="en">
<head>
    <meta charset="UTF-8">
    <meta http-equiv="X-UA-Compatible" content="IE=edge">
    <meta name="viewport" content="width=device-width, initial-scale=1.0">
    <title>基础地图展示</title>

    <link rel="stylesheet" href="https://cdn.jsdelivr.net/gh/openlayers/openlayers.github.io@master/en/v6.8.1/css/ol.css" type="text/css">
    <script src="https://cdn.jsdelivr.net/gh/openlayers/openlayers.github.io@master/en/v6.8.1/build/ol.js"></script>
    <style>

        html,body{
            width: 100%;
            height: 100%;
            padding: 0px;
            margin: 0px;
            box-sizing: border-box;
        }
        #mapBox{
            width: 100vw;
            height: 100vh;
            background-color: antiquewhite;
        }
    </style>
</head>
<body>

    <div id="mapBox"></div>
    <script>
        const map=new ol.Map({
            target:"mapBox",
            layers:[
                new ol.layer.Tile({source:new ol.source.OSM()})
            ],
            view:new ol.View({
                projection:"EPSG:4326",
                // center: ol.proj.fromLonLat([120.13989, 30.27662]),
                center:[120.13989, 30.27662],
                zoom: 11,
                minZoom:10,
                maxZoom:13
            })
        })
    </script>
</body>
</html>
添加图标
 var areaArr = [{
                name: "江干区",
                lng: 120.17999,lat:30.22757
            },
            {
                name: "滨江区",
                lng: 120.20,
                lat: 30.20
            },
            {
                name:"上城区",lng:120.17,lat:30.25
            },{
                name:"下城区",lng:120.17,lat:30.28
            },{
                name:"拱墅区",lng:120.13,lat:30.32
            },{
                name:"西湖区",lng:120.13,lat:30.27
            },{
                name:"萧山区",lng:120.27,lat:30.17
            }
        ]

        var layer = new ol.layer.Vector({ //初始化矢量图形 ,放图标
            source: new ol.source.Vector()
        })

        const map = new ol.Map({
            target: "mapBox",
            layers: [
                new ol.layer.Tile({
                    source: new ol.source.OSM()
                }),
                layer
            ],
            view: new ol.View({
                projection:"EPSG:4326",
                center:[120.13989, 30.27662],
                zoom: 11,
                minZoom:10,
                maxZoom:13
            })
        })
        areaArr.forEach(item => {
            var marker = new ol.Feature({
                type: "icon",
                geometry: new ol.geom.Point([item.lng, item.lat]),
                // img: "./images/location.png"
            })
            marker.setStyle(new ol.style.Style({
                image:new ol.style.Icon({
                    src:"./images/river.png",//如果在vue中使用require("./images/river.png")
                   scale:0.1
                })
            }))

            layer.getSource().addFeature(marker)
        })
效果预览
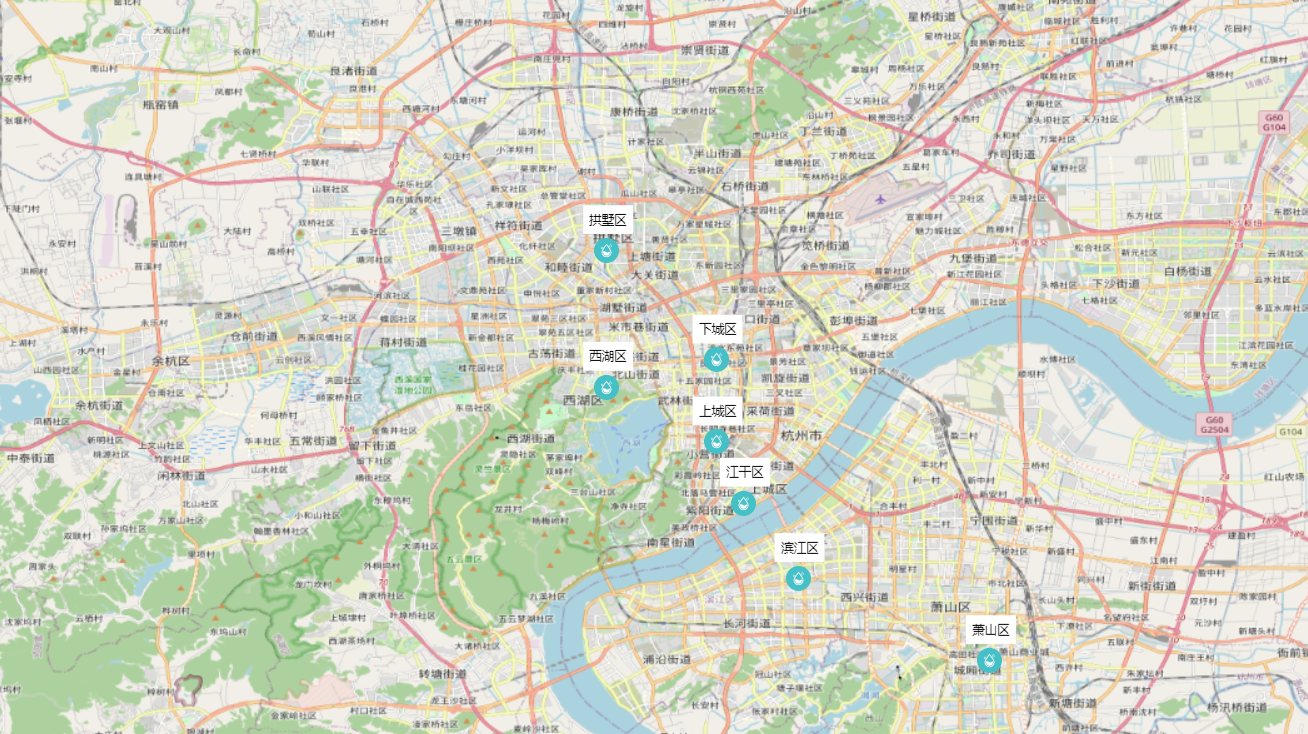
添加标注
areaArr.forEach(item => {
            var marker = new ol.Feature({
                type: "icon",
                geometry: new ol.geom.Point([item.lng, item.lat]),
                // img: "./images/location.png"
            })
            marker.setStyle(new ol.style.Style({
                image:new ol.style.Icon({
                    src:"./images/river.png",
                   scale:0.1,
                   anchor:[10,18],
                   anchorOrigin:"top-left",
                   anchorXUnits:"pixels",
                   anchorYUnits:"pixels",
                   offsetOrigin:"bottom-left"

                }),
                text:new ol.style.Text({
                    textAlign:"center",
                    textBaseLine:"middle",
                    text:item.name,
                    offsetY:-15,
                    offsetX:10,
                    fill:new ol.style.Fill({
                        color:"#000"
                    }),
                    backgroundFill:new ol.style.Fill({
                        color:"#fff"
                    }),
                    padding:[5,3,2,5]
                }),
                zIndex:88
            }))

            layer.getSource().addFeature(marker)


        })
效果展示
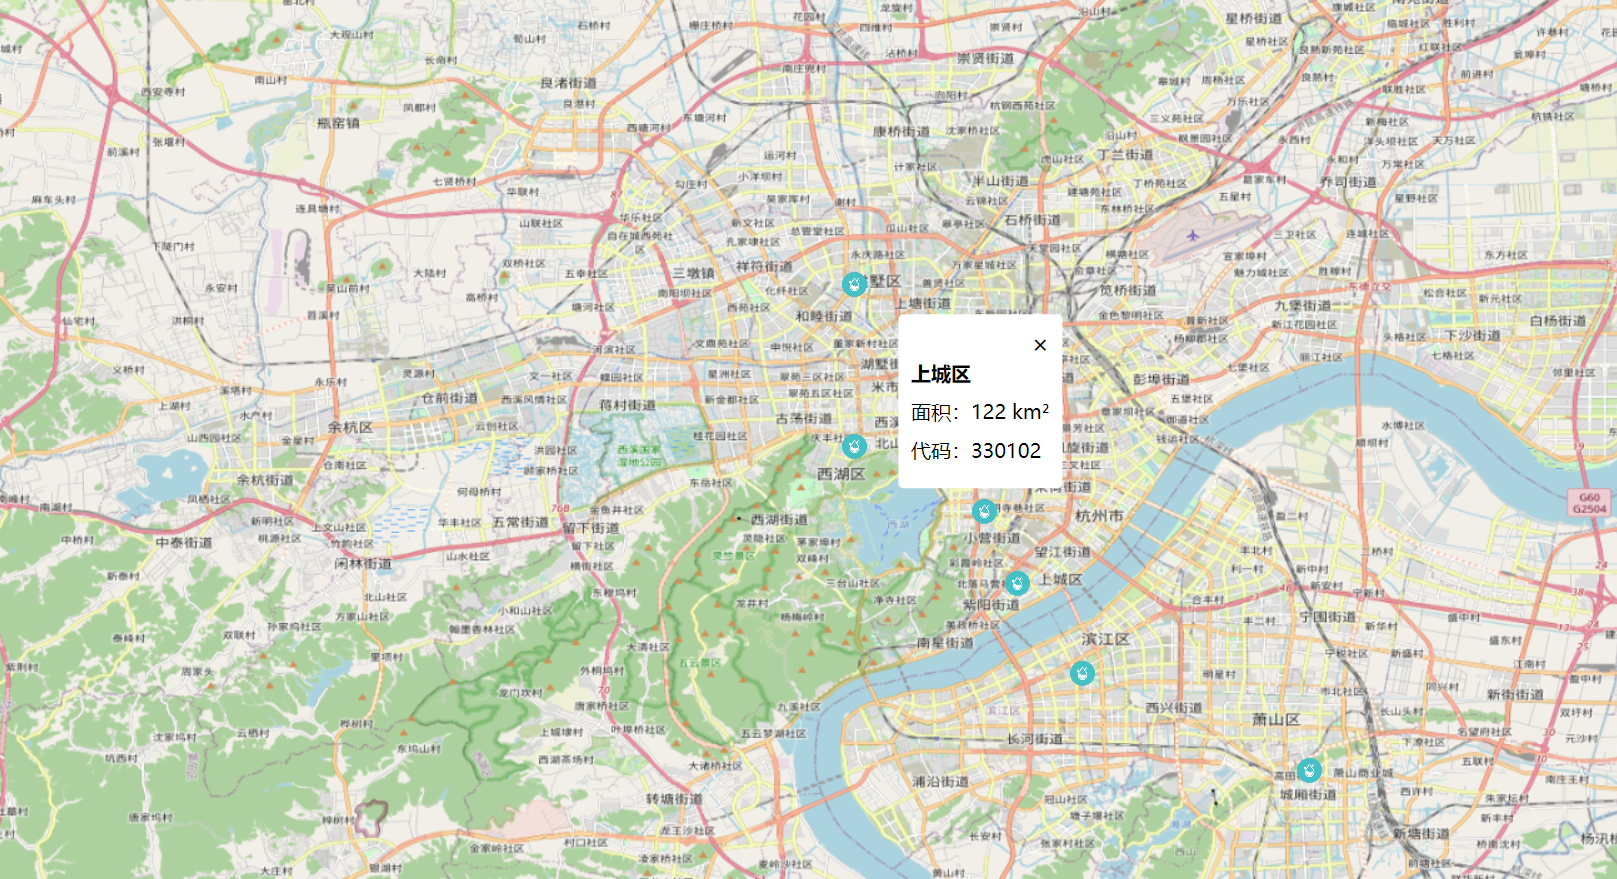
添加弹窗
<!DOCTYPE html>
<html lang="en">

<head>
    <meta charset="UTF-8">
    <meta http-equiv="X-UA-Compatible" content="IE=edge">
    <meta name="viewport" content="width=device-width, initial-scale=1.0">
    <title>添加弹窗</title>

    <link rel="stylesheet" href="./ol.css" type="text/css">
    <script src="./ol.js"></script>

    <style>
        html,
        body {
            width: 100%;
            height: 100%;
            padding: 0px;
            margin: 0px;
            box-sizing: border-box;
        }

        #mapBox {
            width: 100vw;
            height: 100vh;
            background-color: antiquewhite;
        }


        .dialog-area {
            background: #fff;
            position: relative;
            border-radius: 4px;
            padding: 10px;
            white-space: nowrap;

        }

        .dialog-body div {
            margin-bottom: 10px;
            font-size: 14;
        }

        .dialog-body .title {
            font-size: 16px;
            font-weight: bold;
        }

        .close-area {
            text-align: right;
            cursor: pointer;
            font-size: 20px;
        }
    </style>
</head>

<body>

    <div id="mapBox">
    </div>

    <div id="popup" class="dialog-area">
        <div id="close" class="close-area">×</div>
        <div id="content" class="dialog-body">
        </div>
    </div>


    <script>
        var areaArr = [{
                name: "江干区",
                lng: 120.17999,
                lat: 30.22757,
                code: '330104',
                area: "200"
                //
            },
            {
                name: "滨江区",
                lng: 120.20,
                lat: 30.20,
                code: "330108",
                area: "72.22"
            },
            {
                name: "上城区",
                lng: 120.17,
                lat: 30.25,
                code: '330102',
                area: "122"
            }, {
                name: "下城区",
                lng: 120.17,
                lat: 30.28,
                code: "330103",
                area: "29.33"
            }, {
                name: "拱墅区",
                lng: 120.13,
                lat: 30.32,
                code: "330105",
                area: "119"
            }, {
                name: "西湖区",
                lng: 120.13,
                lat: 30.27,
                code: "330106",
                area: "309.41"
            }, {
                name: "萧山区",
                lng: 120.27,
                lat: 30.17,
                code: "330109",
                area: "931"
            }
        ]

        var layer = new ol.layer.Vector({ //初始化矢量图形 ,放图标
            source: new ol.source.Vector()
        })

        const map = new ol.Map({
            target: "mapBox",
            layers: [
                new ol.layer.Tile({
                    source: new ol.source.OSM()
                }),
                layer
            ],
            view: new ol.View({
                projection: "EPSG:4326",
                // center: ol.proj.fromLonLat([120.13989, 30.27662]),
                center: [120.13989, 30.27662],
                zoom: 11,
                minZoom: 10,
                maxZoom: 13
            })
        })


        areaArr.forEach(item => {
            var marker = new ol.Feature({
                type: "areaicon",
                geometry: new ol.geom.Point([item.lng, item.lat]),
            })
            marker.setStyle(new ol.style.Style({
                image: new ol.style.Icon({
                    src: "./images/river.png",
                    scale: 0.1
                })
            }))
            marker.setProperties(item)
            layer.getSource().addFeature(marker)


            // 添加弹窗
            const popup = new ol.Overlay({
                element: document.getElementById('popup'),
                positioning: "bottom-center",
                stopEvent: false, //事件冒泡
                offset: [0, -16]
            });
            map.addOverlay(popup);

            map.on("singleclick", function (evt) {
                console.log(evt)
                var feature = map.forEachFeatureAtPixel(evt.pixel,
                    function (feature) {
                        return feature
                    })
                console.log("feature", feature)
                if (feature) {
                    let params = feature.getProperties();
                    if (params.type = "areaicon") {
                        let coordinate = evt.coordinate;
                        popup.setPosition(coordinate) //展示弹窗
                        let html = `
            <div class="title">${params.name}</div>
            <div>面积:${params.area} km²</div>
            <div>代码:${params.code}</div>
                        `

                        document.getElementById("content").innerHTML=html
                    } else {
                        popup.setPosition(undefined) //隐藏弹窗
                    }
                }
            })

            document.getElementById("close").onclick=function(){
                popup.setPosition(undefined) //隐藏弹窗
            }

        })
    </script>

</body>

</html>
效果
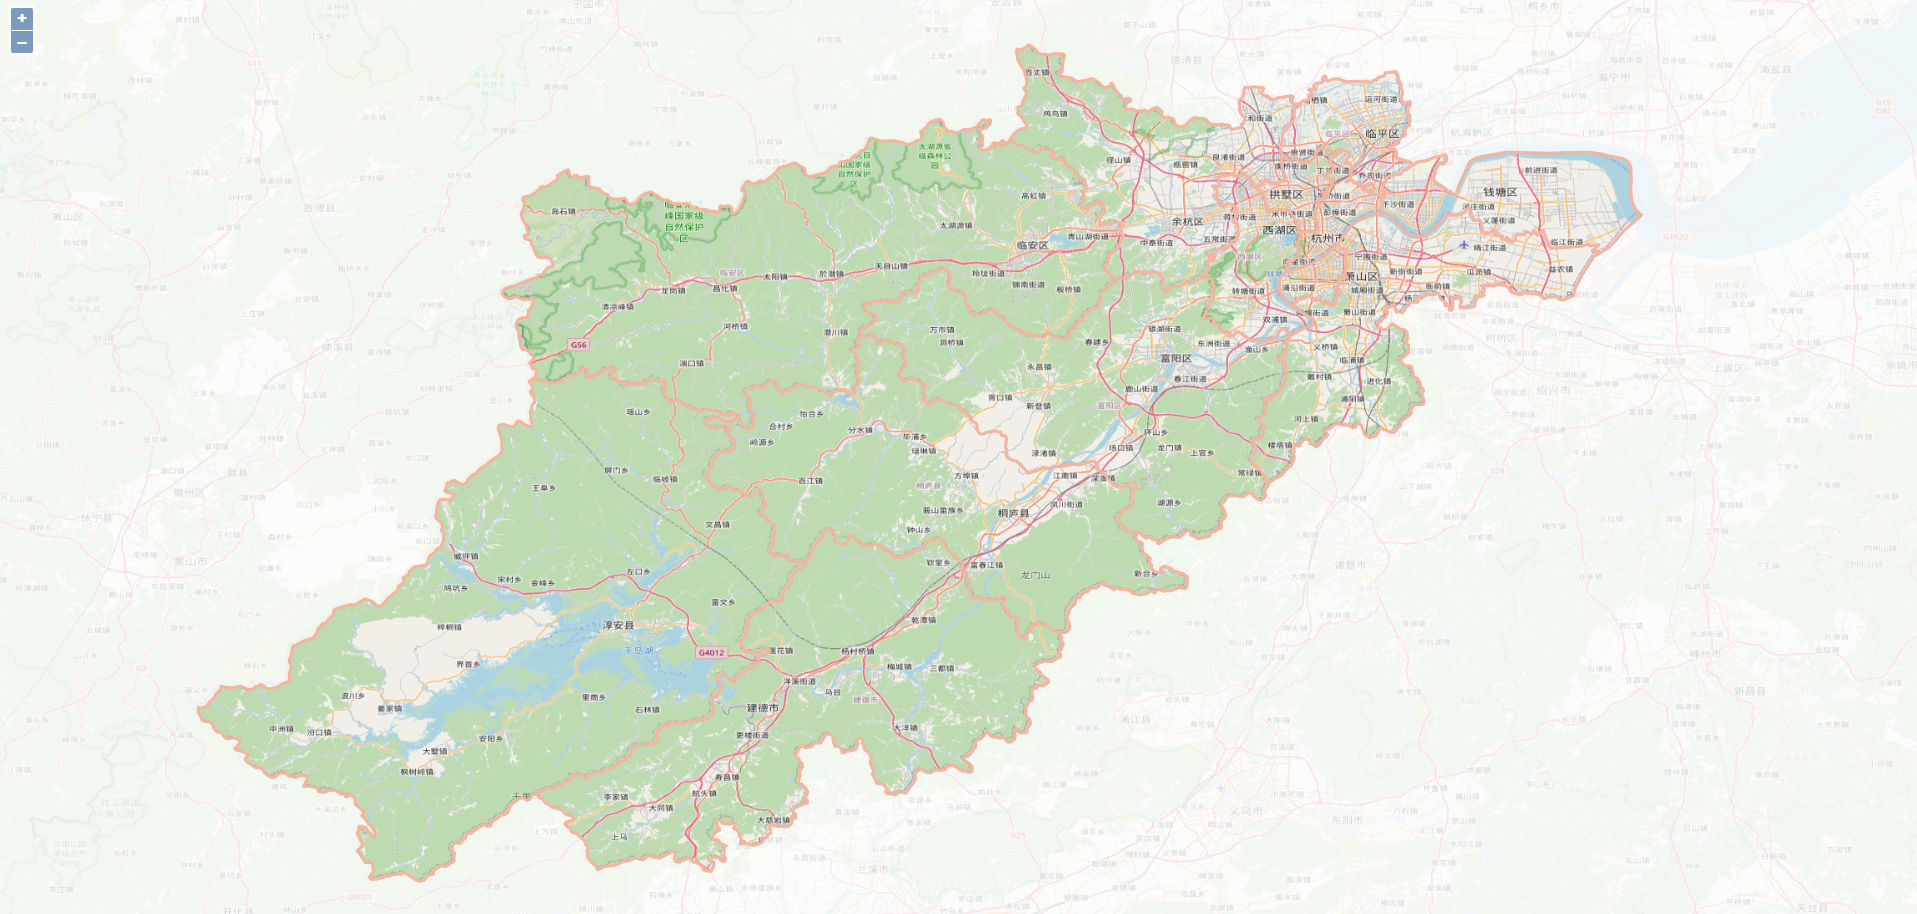
高亮某个地区,周边加上蒙层
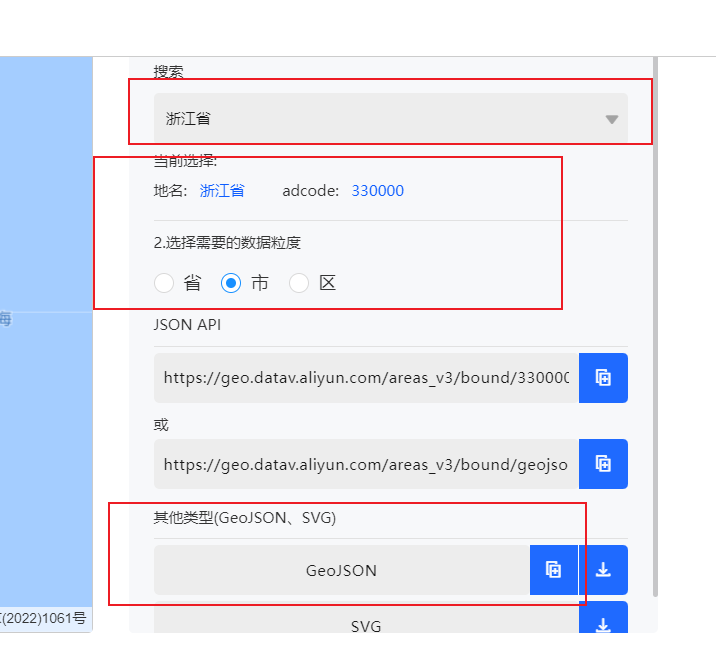
需要的地区数据(hz.json)在这里取 http://datav.aliyun.com/portal/school/atlas/area_selector#&lat=22.65267050733856&lng=114.18983459472656&zoom=10
<!DOCTYPE html>
<html lang="en">

    <head>
        <meta charset="UTF-8">
        <meta http-equiv="X-UA-Compatible" content="IE=edge">
        <meta name="viewport" content="width=device-width, initial-scale=1.0">
        <title>openlayers基础学习</title>
        <!-- <link rel="stylesheet" href="../css/ol.css"> -->
        <link rel="stylesheet" href="./ol.css" type="text/css">
        <script src="./ol.js"></script>
        <script src="https://unpkg.com/axios/dist/axios.min.js"></script>
        <style>
            .map-area {
                position: absolute;
                left: 0px;
                top: 0px;
                bottom: 0px;
                right: 0px;
                background-color: rgb(34, 30, 32);

            }
        </style>
    </head>

    <body>
        <div id="mapBox" class="map-area"></div>
        <!--     <script src="../js/ol.js"></script> -->
        <script>
            // 需要一个vector的layer来放置图标

            var layer = new ol.layer.Vector({
                source: new ol.source.Vector()
            })

            const map = new ol.Map({
                target: "mapBox",
                layers: [new ol.layer.Tile({
                    source: new ol.source.OSM()
                }), layer],
                view: new ol.View({
                    projection: "EPSG:4326",
                    center: [120.43167, 30.28437],
                    zoom: 11,
                    minZoom: 8,
                    maxZoom: 11,
                }),
                style: new ol.style.Text({
                    font: "28px Calibri,sans-serif",
                }),
            });
            showGuangxiArea();


            function showGuangxiArea() {
                let initLayer = new ol.layer.Vector({
                    zIndex: 3,
                    source: new ol.source.Vector(),
                    style: new ol.style.Style({
                        fill: new ol.style.Fill({
                            color: "rgba( 255, 255, 255, 0.8)",
                        }),
                        stroke: new ol.style.Stroke({
                            color: "#f4b49f",
                            width: 3
                        })
                    })
                });
                map.addLayer(initLayer);
                axios.get('./hz.json').then(({ //如果是vue中可以直接使用 let data=require("./hz.json")获取数据
                    data
                }) => {
                    addConver(initLayer, data);
                });
            };


            //添加遮罩
            function addConver(converLayer, data) {
                const fts = new ol.format.GeoJSON().readFeatures(data);
                const converGeom = erase(fts);
                const convertFt = new ol.Feature({
                    geometry: converGeom,
                });
                converLayer.getSource().addFeature(convertFt);
            };
            //擦除操作,生产遮罩范围
            function erase(geom) {
                const extent = [-180, -90, 180, 90];
                const polygonRing = ol.geom.Polygon.fromExtent(extent);
                // 擦除操作
                for (let i = 0, len = geom.length; i < len; i++) {
                    let g = geom[i].getGeometry();
                    const coords = g.getCoordinates();
                    coords.forEach(coord => {
                        const linearRing = new ol.geom.LineString(coord[0]);
                        polygonRing.appendLinearRing(linearRing);
                    });
                }
                return polygonRing;
            };
        </script>
    </body>

</html>
效果展示
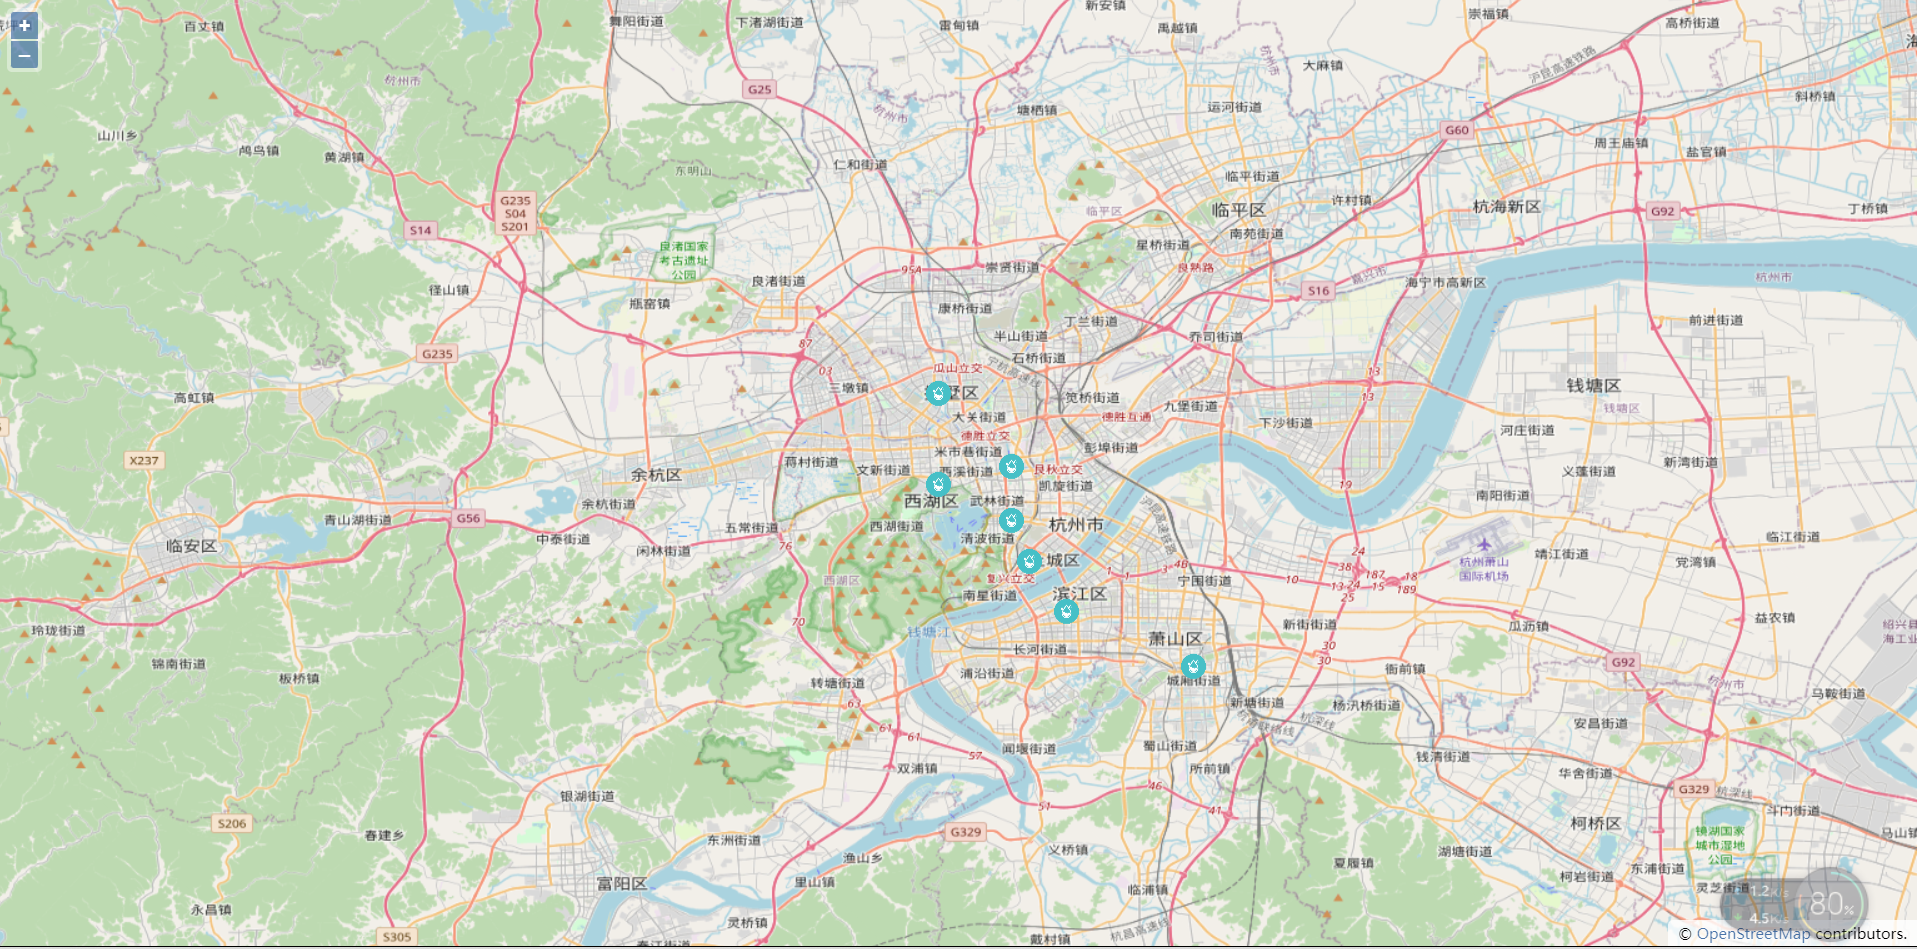
聚合
完整代码
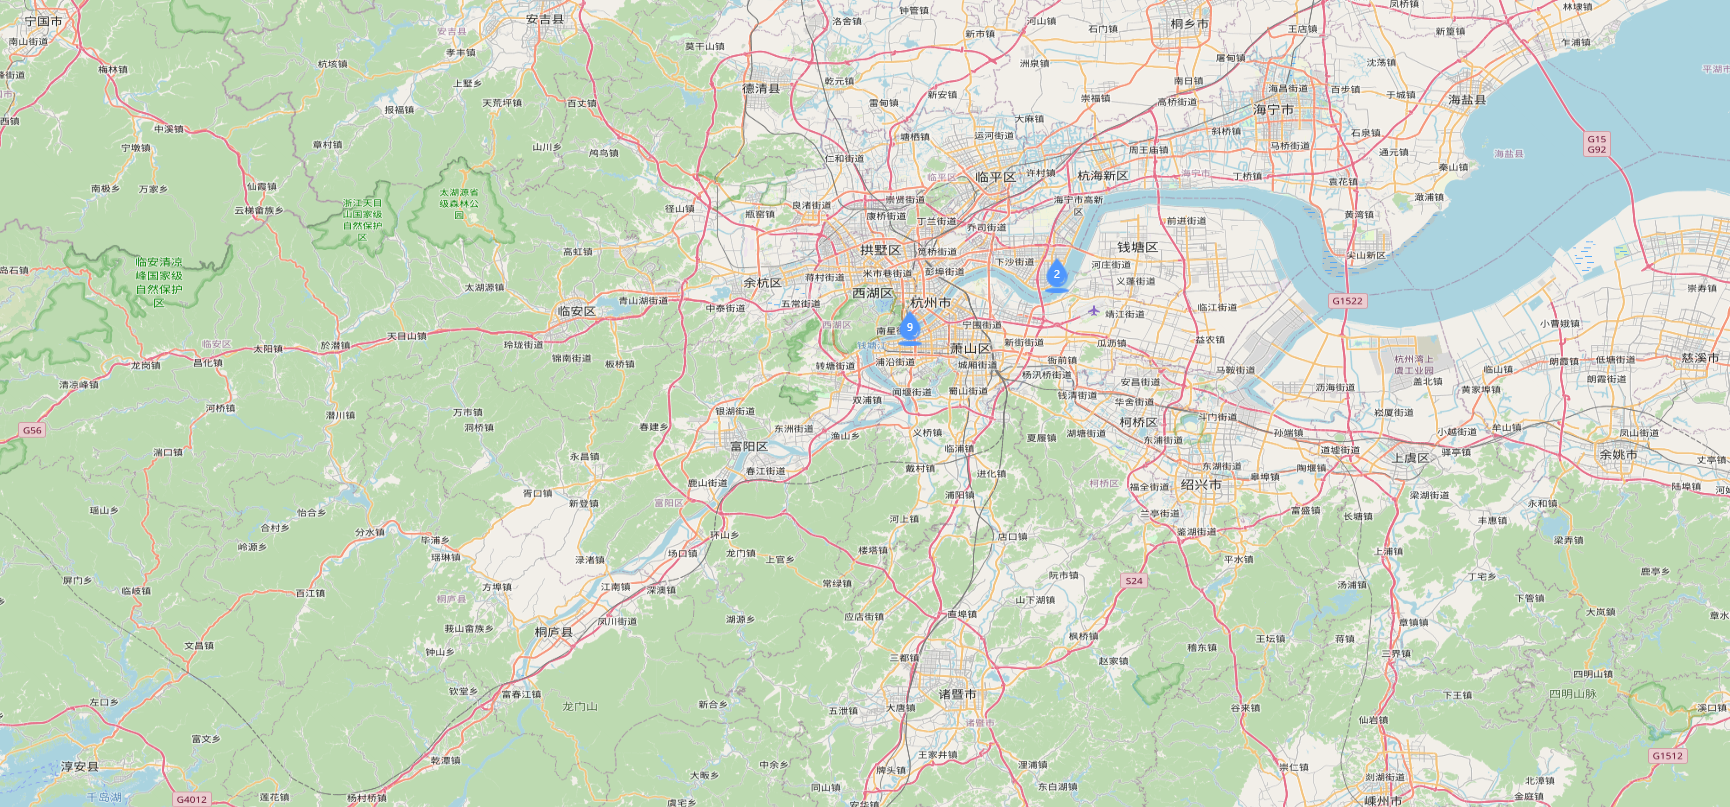
<!DOCTYPE html>
<html>
    <head>
        <meta http-equiv="Content-Type" content="text/html; charset=utf-8" />
        <meta charset="utf-8" />
        <title>OpenLayers</title>
        <style>
            html,
            body,
            #map {
                width: 100%;
                height: 100%;
                margin: 0;
                padding: 0;
            }
        </style>
        <link href="./ol.css" rel="stylesheet" />
        <script src="./ol.js"></script>
    </head>
    <body>
        <div id="map"></div>

        <script>
            var video = [{
                    Lng: 120.397359,
                    Lat: 30.318246,
                    name: "850-盘头",
                },
                {
                    Lng: 120.221881,
                    Lat: 30.236172,
                    name: "奥体码头",
                },
                {
                    Lng: 120.113147,
                    Lat: 30.160005,
                    name: "东风船厂遗址",
                },
                {
                    Lng: 120.266744,
                    Lat: 30.293717,
                    name: "七堡一号坝",
                },
                {
                    Lng: 120.224603,
                    Lat: 30.262383,
                    name: "三堡船闸口门站",
                },
                {
                    Lng: 120.145832,
                    Lat: 30.203055,
                    name: "闸口水文站",
                },
                {
                    Lng: 120.175551,
                    Lat: 30.129062,
                    name: "闻家堰"
                }, {
                    Lng: 120.11335,
                    Lat: 30.202395,
                    name: '九溪'
                }, {
                    Lng: 120.150109,
                    Lat: 30.20303,
                    name: "闸口"
                }, {
                    Lng: 120.177384,
                    Lat: 30.217295,
                    name: "南星桥"
                }, {
                    Lng: 120.360679,
                    Lat: 30.25214,
                    name: '下沙大桥'
                }
            ];
            // 随机创建1000个要素
            var source = new ol.source.Vector();
            video.forEach((item, index) => {
                var marker = new ol.Feature({
                    type: "icon",
                    geometry: new ol.geom.Point([item.Lng, item.Lat])
                })
                marker.setProperties(item)
                source.addFeature(marker)
            })

            // 聚合
            var cluster = new ol.source.Cluster({
                source: source,
                distance: 100
            })

            // 创建图层
            var layer = new ol.layer.Vector({
                source: cluster,
                style: function(feature, resolution) {
                    var size = feature.get('features').length;
                    var style = new ol.style.Style({
                        image: new ol.style.Icon({
                            src: '../images/icon-blue.png',
                            scale: 1.2

                        }),
                        text: new ol.style.Text({
                            text: size.toString(),
                            fill: new ol.style.Fill({
                                color: 'white'
                            })
                        })
                    })
                    return style;
                }
            });

            // 创建地图
            var map = new ol.Map({
                target: 'map',
                layers: [
                    new ol.layer.Tile({
                        source: new ol.source.OSM()
                    }),
                    layer
                ],
                view: new ol.View({
                    projection: 'EPSG:4326',
                    center: [120, 30],
                    zoom: 10,
                    minZoom: 5,
                    maxZoom: 14
                }),
                interactions: ol.interaction.defaults({
                    doubleClickZoom: false, // 取消双击放大功能交互
                }),
            });


        </script>
    </body>
</html>
效果
监听地图缩放
this.mapObj.on('moveend', () => {
        const view = this.mapObj.getView()
        const zoom = view.getZoom()
        if (zoom >= 11) {
          console.log('大于12',zoom)
          // 展示icon标签
        } else {
          // 隐藏 icon 标签
          console.log('小于12',zoom)

        }
      })
vue2中使用ol(openlayers)
npm create vite@latest 创建vue2+vite项目
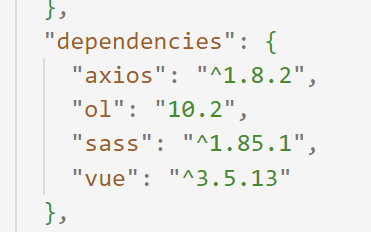
安装命令 npm i ol@10.2 --save (可以提前使用 npm view ol versions 查看ol有哪些版本)
npm i sass axios 安装所需的插件
在openlayers 官网中查看api
https://openlayers.org/en/v9.2.4/apidoc/module-ol_Map-Map.html
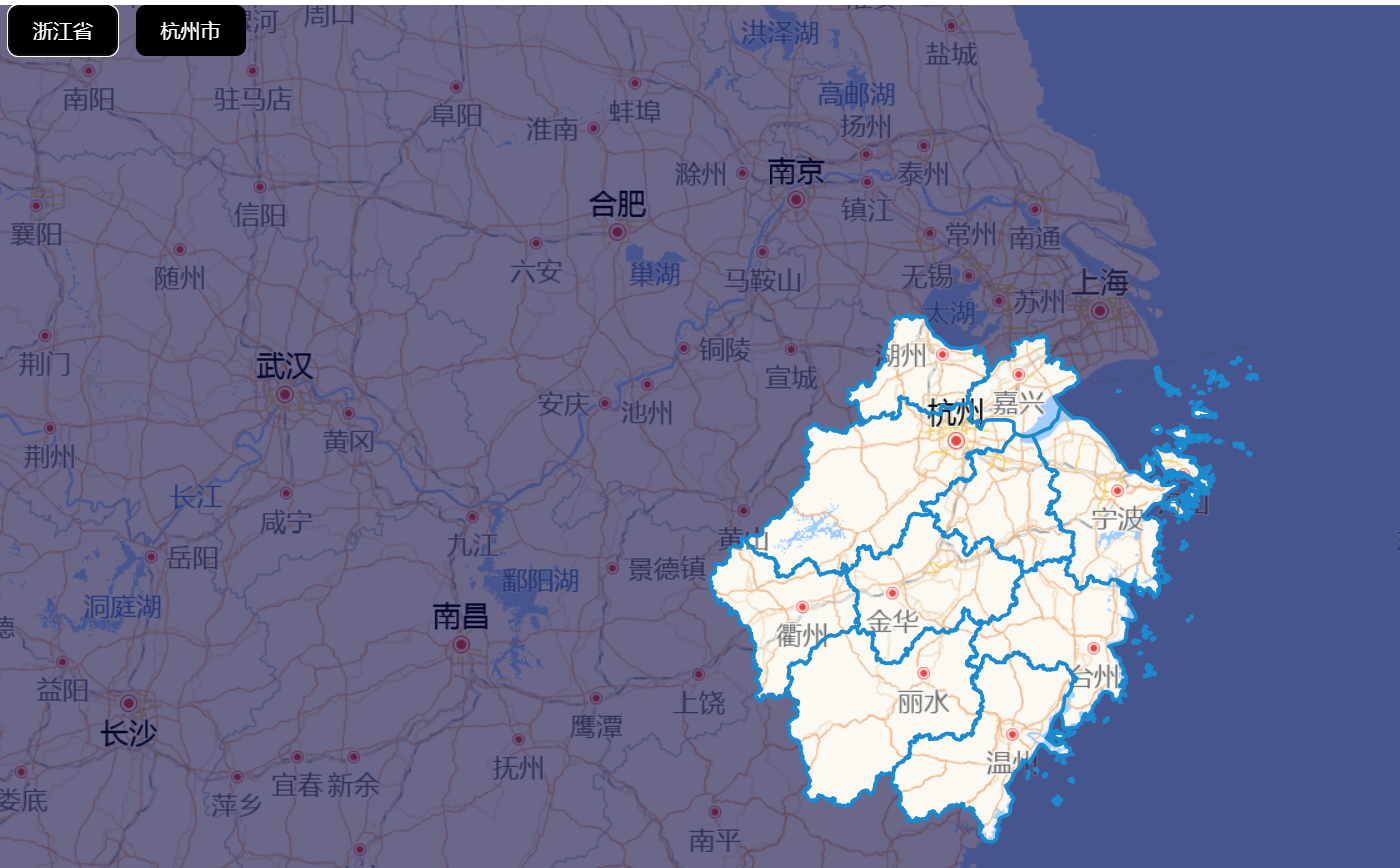
效果图如下:点击浙江省展示浙江省高亮,点击杭州市展示杭州市高亮
完整代码如下:
<script> import "ol/ol.css"; import { Map, View, Feature } from "ol"; // import {VectorLayer} from "ol/layer"; import TileLayer from "ol/layer/Tile.js"; import Stroke from "ol/style/Stroke"; import Style from "ol/style/Style"; import Fill from "ol/style/Fill"; import XYZ from "ol/source/XYZ"; import OSM from "ol/source/OSM"; import VectorLayer from "ol/layer/Vector"; import VectorSource from "ol/source/Vector"; import GeoJSON from "ol/format/GeoJSON.js"; import MultiPolygon from "ol/geom/MultiPolygon.js"; import { fromLonLat } from "ol/proj"; import { Polygon, LineString } from "ol/geom"; import { fromExtent } from "ol/geom/Polygon"; import { defaults as defaultControls } from "ol/control"; import axios from "axios"; export default { data() { return { map: null, vLayer: null, }; }, mounted() { this.initMap(); }, methods: { initMap() { this.map = new Map({ target: "map", // 地图实例 layers: [ // new TileLayer({ // source: new OSM(), // }), new TileLayer({ source: new XYZ({ url: "http://wprd0{1-4}.is.autonavi.com/appmaptile?lang=zh_cn&size=1&style=7&x={x}&y={y}&z={z}", wrapX: false, // 是否重复显示地图 }), }), ], // 将图层加载到地图 view: new View({ // projection: "EPSG:4326", center: fromLonLat([120.13989, 30.27662]), // center: [120.13989, 30.27662], zoom: 7, minZoom: 6, maxZoom: 13, }), // 地图中心点和默认大小 controls: defaultControls({ zoom: false, }), // 移除放大缩小控件 }); }, handleArea(info) { if (this.vLayer) { this.map.removeLayer(this.vLayer); //切换地区的时候首先要清空已存在的遮罩层 } this.showGuangxiArea(info); }, showGuangxiArea(city) { let initLayer = new VectorLayer({ zIndex: 3, source: new VectorSource(), style: new Style({ fill: new Fill({ color: "rgba( 255, 255, 255, 0.8)", }), stroke: new Stroke({ color: "#f4b49f", width: 3, }), }), }); this.map.addLayer(initLayer); // https://geo.datav.aliyun.com/areas_v3/bound/330000.json //如果是vue中可以直接使用 let data=require("./hz.json")获取数据 axios.get(`/src/static/${city}.json`).then(({ data }) => { console.log("输出", data); this.addConver(data); }); }, //添加遮罩 addConver(data) { console.log("data", data); let features = []; const format = new GeoJSON(); const fts = format.readFeatures(data, { dataProjection: "EPSG:4326", featureProjection: "EPSG:4326", }); features.push(fts); const converGeom = this.erase(fts); const convertFt = new Feature({ geometry: converGeom.transform("EPSG:4326", "EPSG:3857"), }); convertFt.setStyle( new Style({ fill: new Fill({ color: "rgba(8,5,66,0.6)", }), stroke: new Stroke({ color: "#1c8acf", width: 3, }), }) ); this.vLayer = new VectorLayer({ source: new VectorSource({ features: [convertFt], }), }); this.vLayer.setZIndex(2); //设置一下层级 this.map.addLayer(this.vLayer); //添加到地图上 }, //生产遮罩范围 erase(fes) { const extent = [-180, -90, 180, 90]; const polygonRing = fromExtent(extent); // 擦除操作 // 边界线可能不止一个,所以得循环操作一下 for (let i = 0, len = fes.length; i < len; i++) { let geom = fes[i].getGeometry(); let isMulit = false; if (geom instanceof MultiPolygon) isMulit = true; const coords = geom.getCoordinates(); coords.forEach((coord) => { let arr = coord[0]; if (!isMulit) arr = coord; //单面 const linearRing = new LineString(arr); polygonRing.appendLinearRing(linearRing); }); } return polygonRing; }, }, }; </script> <template> <div class="box"> <div class="btn-area"> <button @click="handleArea('zhejiang')">浙江省</button> <button @click="handleArea('hangzhou')">杭州市</button> </div> <div id="map"></div> </div> </template> <style lang="scss" scoped> .box { width: 100%; height: 100%; } .btn-area { position: absolute; left: 0px; top: 0px; z-index: 99; button { background: black; color: white; } } #map { position: absolute; z-index: 9; top: 0px; bottom: 0px; width: 100vw; height: 100vh; } </style>
zhejiang.json和hangzhou.json在下面这个地址中查找
学习地址(vue2+ol添加标点)
https://blog.csdn.net/weixin_39277183/article/details/140974052
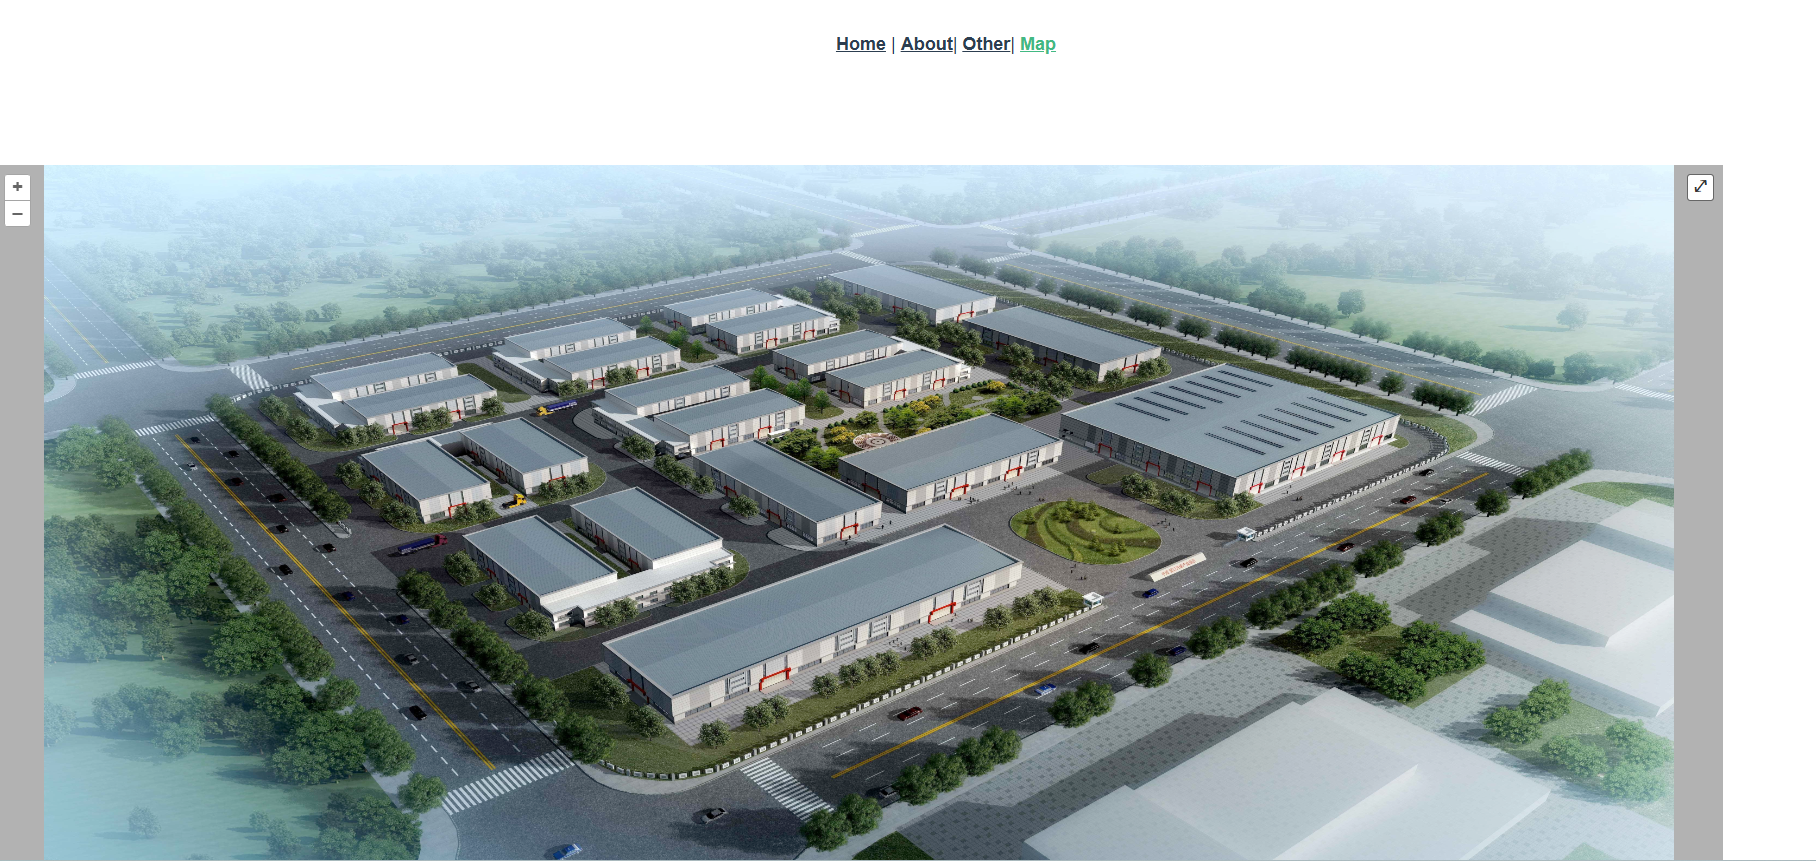
在地图上贴静态图
参考博客:https://blog.csdn.net/qq_45554167/article/details/127575741
<template>
  <div class="box">
    <div id="mymap"></div>
  </div>
</template>

<script>
import "ol/ol.css";
import { Map, View, Feature } from "ol";
import { Image as ImageLayer } from "ol/layer";
// import TileLayer from "ol/layer/Tile.js";
// import Stroke from "ol/style/Stroke";
// import Style from "ol/style/Style";
// import Fill from "ol/style/Fill";
// import XYZ from "ol/source/XYZ";
// import OSM from "ol/source/OSM";
// import VectorLayer from "ol/layer/Vector";
// import VectorSource from "ol/source/Vector";
// import GeoJSON from "ol/format/GeoJSON.js";
// import MultiPolygon from "ol/geom/MultiPolygon.js";
// import { fromLonLat } from "ol/proj";
// import { Polygon, LineString } from "ol/geom";
// import { fromExtent } from "ol/geom/Polygon";
import { ImageStatic } from "ol/source";
import { getCenter } from "ol/extent";
import { Projection } from "ol/proj";

import { defaults as defaultControls } from "ol/control";

import staticMap from "../assets/map.jpeg";

import Zoom from "ol/control/Zoom";
import { FullScreen, MousePosition } from "ol/control";
export default {
  name: "mymap",
  data() {
    return {
      map: null,
      vLayer: null,
    };
  },
  mounted() {
    this.initMap();
  },
  methods: {
    initMap() {
      let extent = [0, 0, 1296, 600]; // 获取图片的宽高
      let projection = new Projection({
        code: "xkcd-image",
        units: "pixels",
        extent: extent,
      });
      this.map = new Map({
        // interactions: olInteraction
        //   .defaults()
        //   .extend([new DragRotateAndZoom()]),

        target: "mymap", // 地图实例
        layers: [
          new ImageLayer({
            source: new ImageStatic({
              url: staticMap, // 静态地图
              projection: projection,
              imageExtent: extent,
              //   restrictedExtent: [0, 0, 1080, 600],
            }),
          }),
        ], // 将图层加载到地图
        view: new View({
          // projection: "EPSG:4326",
          projection: projection,
          //   center: fromLonLat([120.13989, 30.27662]),
          center: getCenter(extent),
          // center: [120.13989, 30.27662],
          zoom: 2.5,
          minZoom: 1,
          maxZoom: 13,
        }), // 地图中心点和默认大小
        controls: defaultControls({
          zoom: false,
          rotate: true,
        }).extend([
          new FullScreen({
            tipLabel: "全屏",
          }),
          new Zoom({
            zoomInTipLabel: "放大",
            zoomOutTipLabel: "缩小",
          }),
        ]), // 移除放大缩小控件
      });
    },
  },
};
</script>

<style scoped>
.box {
  width: 100%;
  height: 100%;
}
.btn-area {
  position: absolute;
  left: 0px;
  top: 0px;
  z-index: 99;
  /* button {
    background: black;
    color: white;
  } */
}

#mymap {
  position: absolute;
  z-index: 9;
  background: rgba(0, 0, 0, 0.3);
  top: 20vh;
  bottom: 0px;
  width: 90vw;
  height: 80vh;
}
</style>
持续记录……

 浙公网安备 33010602011771号